



Binance Bitcoin reserves keep climbing while BTC bounces near $81K, and the whale ratio isn’t screaming panic, though a rebound like this needs buyers to hold.
Binance is holding about 702,900 BTC, per CryptoQuant data, the highest reading on its reserve chart at any point in 2026. Bitcoin has crawled back to roughly $81K too, and that’s where things get awkward.
The read comes from XWIN Japan, in a fresh CryptoQuant quicktake that treats the reserve climb as a caution flag for the bounce. Deposits don’t prove anyone is selling, the note admits. They do put more coins within reach of a sell button. Balances can also rise from plain custody moves, so the number is a hint, not a verdict.
Reserves Turned Up After April
Back in late April, the gauge sat near 616,000 BTC. It turned upward after that, and the climb got steeper from August onward. Call it 87,000 BTC of extra stock, give or take, while price went from somewhere near $63K to the low $80Ks. DefiLlama’s Binance wallet tracker shows the same shape, from about 547K BTC in late April to roughly 652K now. Its total runs lower because it counts fewer addresses.

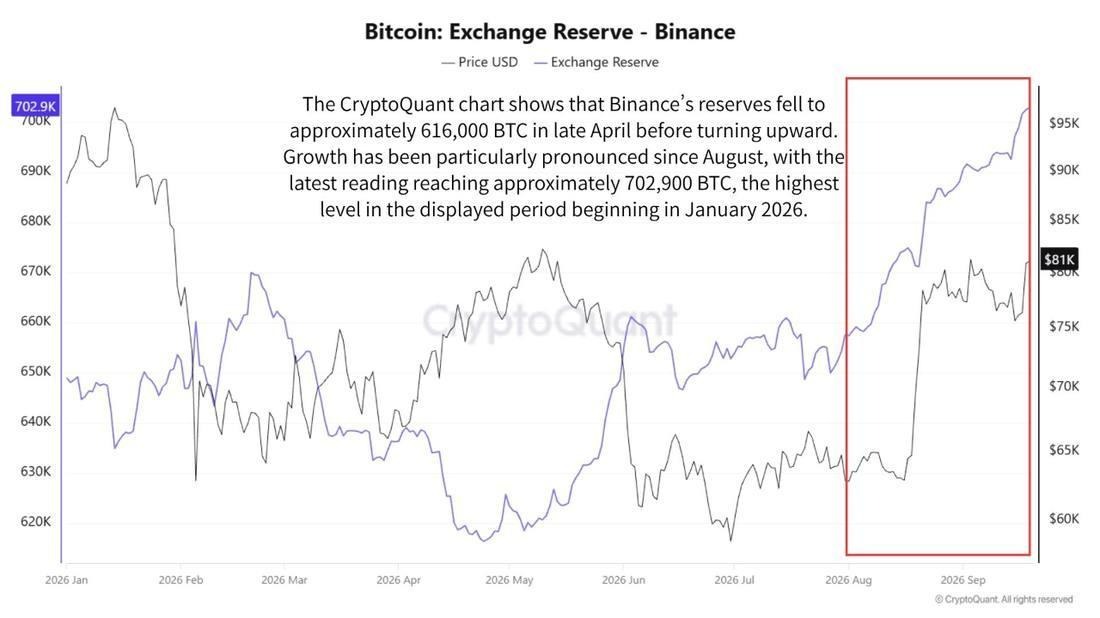
Source: CryptoQuant, Binance Bitcoin Exchange Reserve chart, posted by XWIN Japan.
Inflows Keep Trickling In
Net flows tell the other half. According to the chart, several episodes since late August brought net inflows measured in thousands of BTC. The latest print is smaller, a net 439 BTC, but it points the same direction.
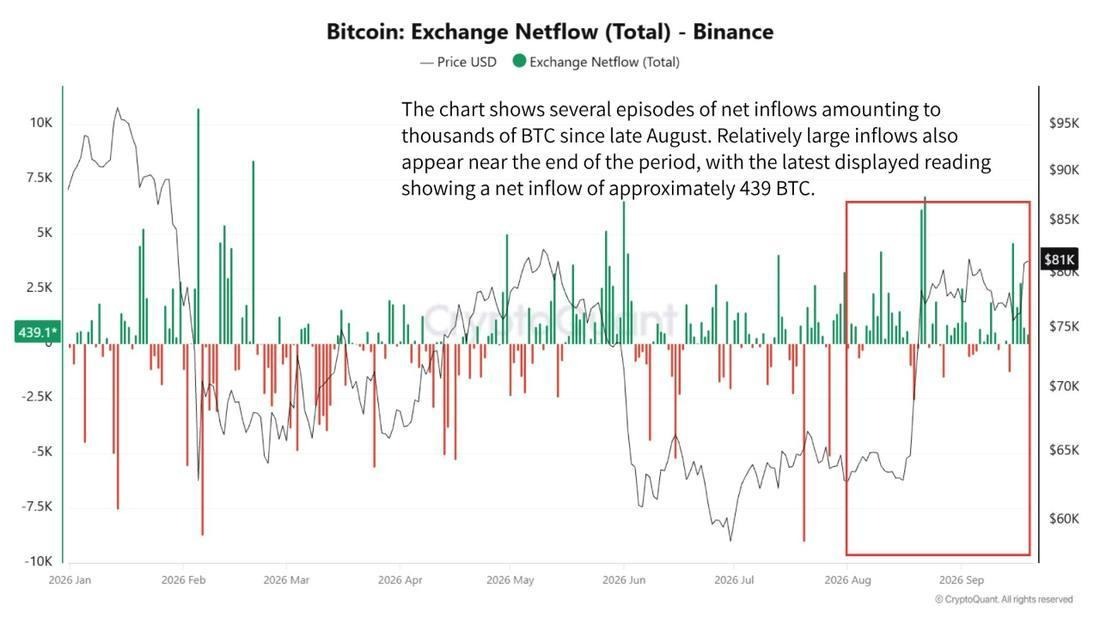
Source: CryptoQuant, Binance Bitcoin Exchange Netflow (Total) chart, posted by XWIN Japan.
It isn’t a one-way street, mind you. Red bars for net outflows still pop up between the green ones. Since late August, though, the green ones have run taller.
Supply arriving mid-rebound, basically. XWIN Japan watches Coinbase for U.S. demand and Binance for global flows. Binance carried 38.3% of spot volume among the top ten centralized exchanges in December 2025, per CoinGecko figures the note cites. That’s a big slice of the market to be adding supply.
Other coins felt the bounce too. Hyperliquid’s HYPE hit a new all-time high around $94, while XRP and XLM also climbed, with XRP back above $1.40 and XLM near 20 cents.
Whales Aren’t Driving This Yet
The Exchange Whale Ratio sits near 0.43. That’s under earlier peaks on the chart, though it spiked a few times through August and September. The ratio tracks how much of total inflow comes from the biggest depositors, which means a high number hints at whales moving coins in.
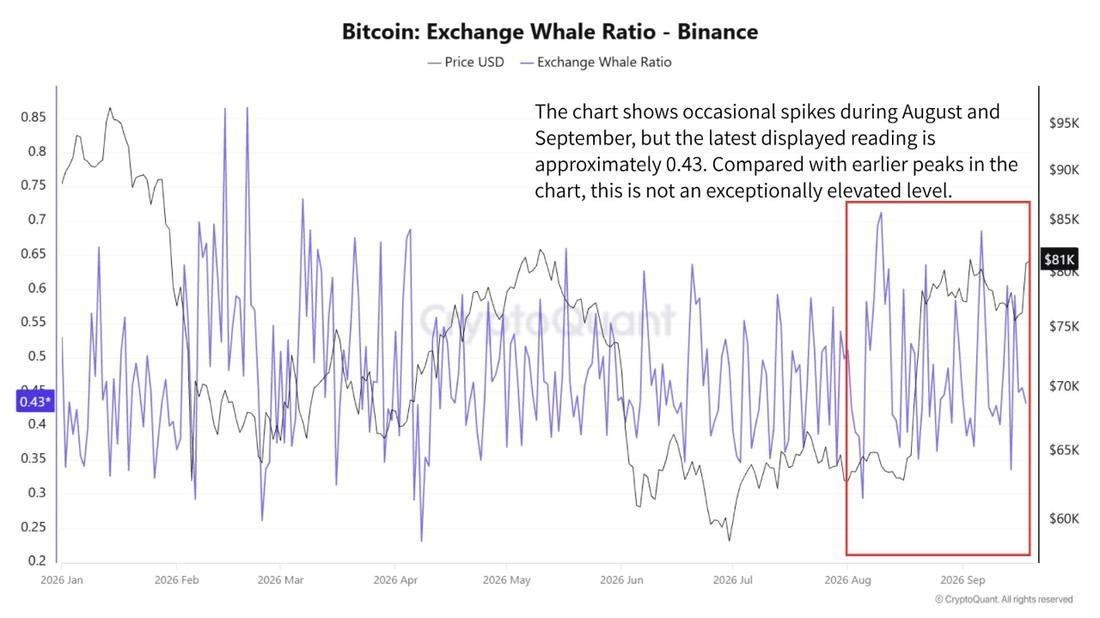
Source: CryptoQuant, Binance Bitcoin Exchange Whale Ratio chart, posted by XWIN Japan.
Nothing here backs a loud whale-led dump story. Still, the note stops short of calling things clear. Piled-up exchange supply is supply that could be sold, and a lasting move needs buyers to soak it up.
Daily Chart Sits Under $82K
On the daily chart, the ceiling is easy to spot. BTC printed highs between $82.3K and $82.9K in May and again near $82.3K in early September. That cluster of near-equal highs sits roughly 1% above where price trades now, and resting buy stops tend to pile up over levels like that.
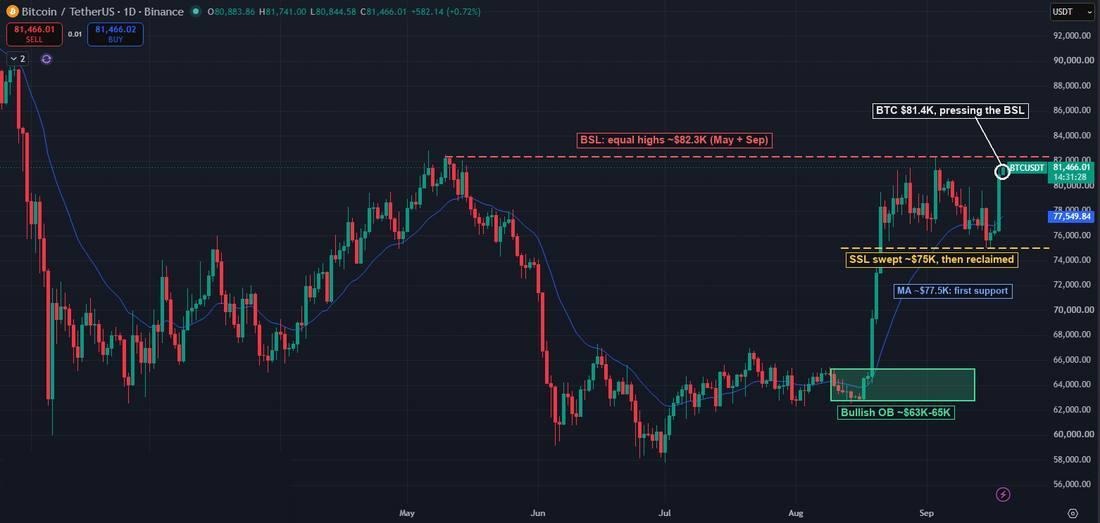
Source: TradingView / Binance, BTC/USDT daily chart.
The mid-September dip to about $75K reads like a sweep of the lows followed by a quick reclaim. One big green daily candle then dragged price back to $81K. Below sits the moving average near $77.5K, and under that the $63K to $65K base where the August impulse started.
Lay the two datasets side by side, and it gets a little uncomfortable. Price leans on a liquidity pool while Binance’s reserves sit at a 2026 high. A daily close above $82.3K would flip the structure bullish. A rejection, with exchange stock this large, hands sellers something to work with, and the $77.5K to $75K zone comes back into play.
Until stronger spot demand shows, the price rebound on its own is thin proof of anything lasting.
This piece covers an analyst’s on-chain read plus a chart view, and neither is financial or investment advice.


Be the first to comment