



What to know:
- BNB tests the $745 resistance after breaking above its long-term descending trendline.
- A weekly close above $745 could target $960, followed by the $1,376 all-time high zone.
- RSI reached 81.40 as bullish MACD momentum rose, while derivatives activity weakened.

BNB price approached a major breakout zone on Monday, August 24, 2026, after moving above a descending trendline. Analysts said the next weekly close could determine whether the token begins a new sustained expansion phase.
As of press time, Binance Coin (BNB) is trading at $696.92, showing an increase of 0.96% in a day. The 24-hour trading volume is currently standing at $1.76 billion, with a market capitalization of $92.75 billion. Over the last week, the BNB price has gone up by 15.38%, according to CoinMarketCap.
Also Read: DOGE Price Eyes $5 Breakout as Robinhood Expands Access Across Europe

Why Is $745 Crucial for the BNB Price Breakout?
Crypto analyst Einstein pointed out that BNB managed to move above the descending trendline and is now probing the $745 hurdle, which, according to him, is the price point that will determine if the BNB price enters a new period of expansion.
A bullish close above $745 on the weekly timeframe may see $960 become the initial upside target, with $1,376 coming next, where BNB can test its previous all-time high.
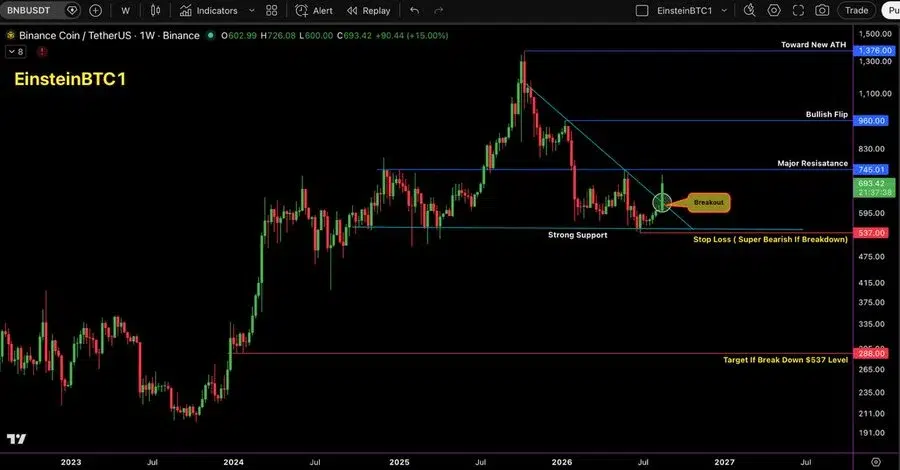
The bearish setup stays intact only until BNB manages to maintain above the $537 support level on the higher timeframes. Any break below that support level may lead to a breakdown for the BNB price.
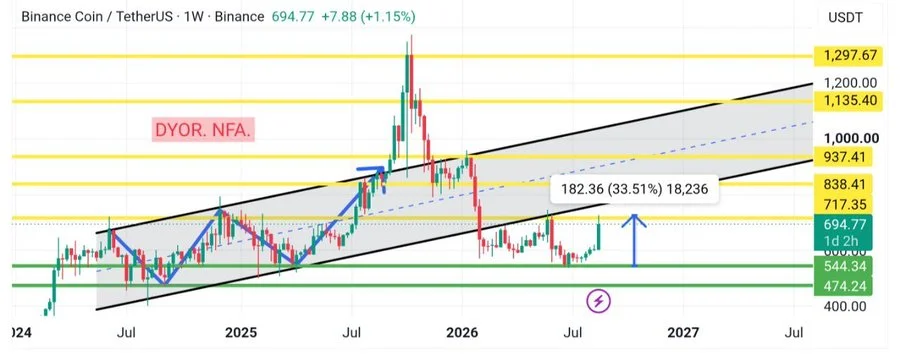
In addition, another analyst, The Boss, mentioned that the weekly chart is still respecting a broad ascending channel. The latest rally began at the lower support level of the said channel and headed toward the resistance level inside the chart.
A clear breakout, followed by a weekly close above the zone, can create an opportunity to move toward the resistance level of the channel. Failure to do so may allow BNB to return to lower support.
What Do RSI and MACD Signal for BNB Price?
According to TradingView data, the daily Relative Strength Index (RSI) registered 81.40, while its moving average reading is 69.58. An RSI reading of more than 70 suggests an overbought condition, implying very high momentum but increased chances of profit-taking.
The Moving Average Convergence Divergence (MACD) line is recorded at 27.13, with the signal line at 17.37. Its positive histogram is measured at 9.76. This is indicative of the presence of powerful bullish momentum on the daily chart.
How Could Derivatives Activity Affect BNB Price?
The derivatives metrics show reduced involvement in spite of the current rise in BNB’s price. CoinGlass data shows that the futures volume has fallen by 45.63% to $944.82 million, while the open interest declined by 0.95% to $1.09 billion.
The OI-weighted funding rate stayed positive at 0.0087%, indicating a slight bias towards long positions. The current market trend will be determined by whether the buyers manage to reach the $745 level or sellers force another test of the lower channel support.
Also Read: SUI Price Eyes $10 Target as Explosive Bullish Pattern Re-emerges



Be the first to comment