


The bulls have managed to avoid a Bitcoin breakdown out of a rising channel pattern with a 4.2% rally. However, now that the $BTC price is back inside the rising channel can it stay there, or are overbought conditions and firm resistance going to drag it back down?
$BTC price breaks back into the ascending channel
Source: TradingView

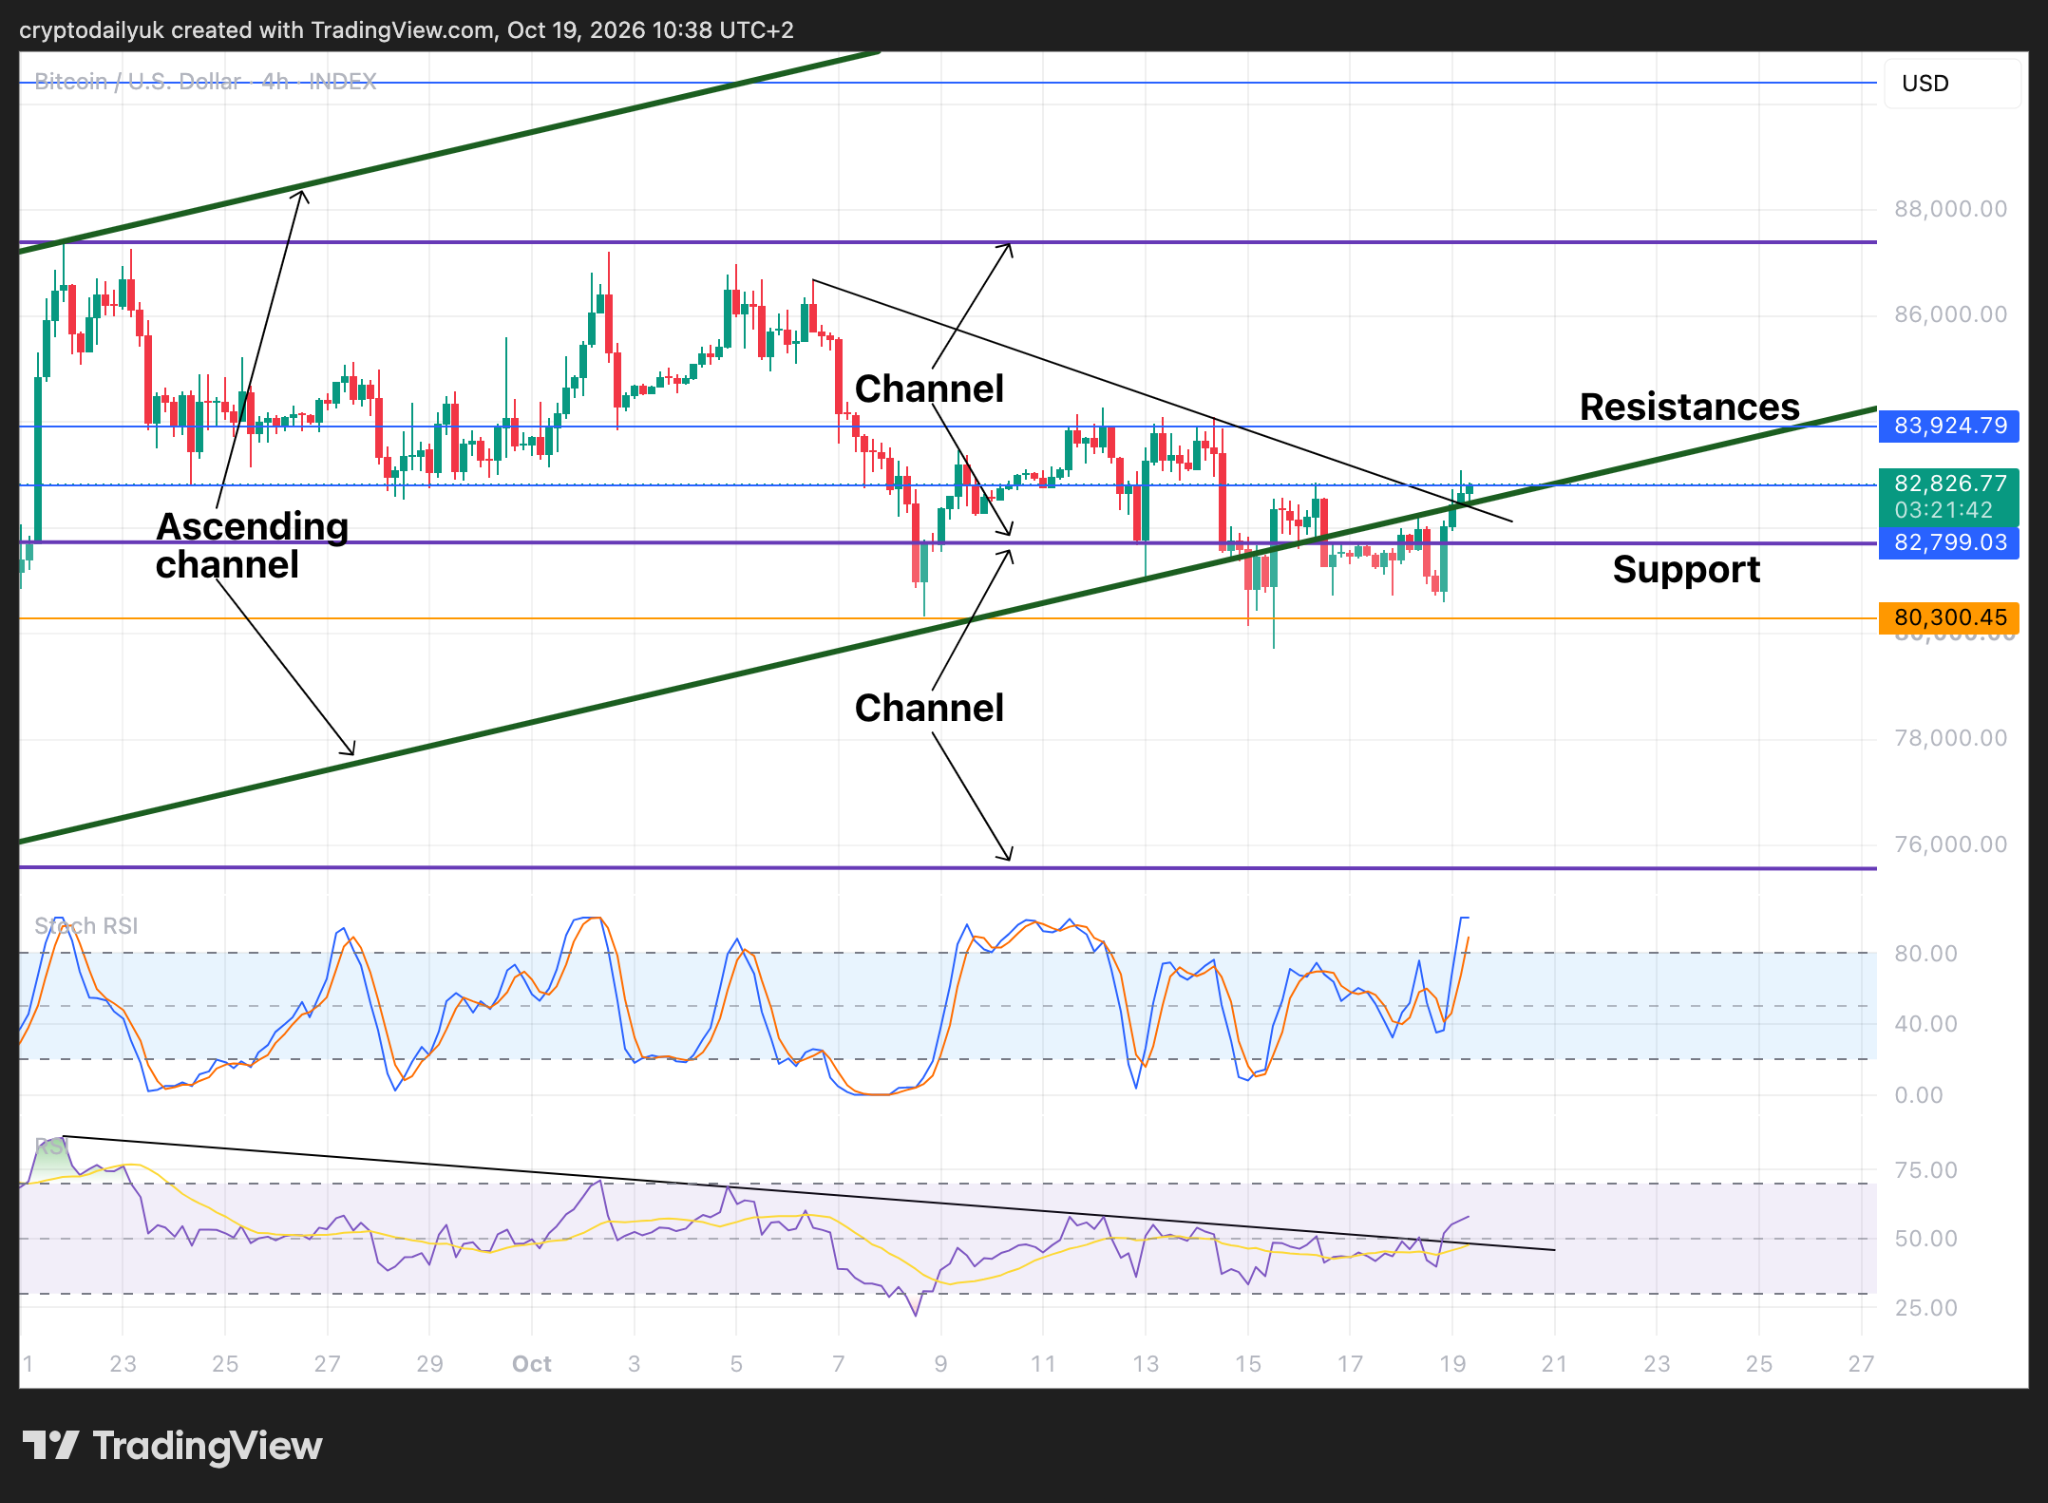
Zooming down into the 4-hour time frame we can see that the $BTC price has just about managed to get back into the big ascending channel. This is a very positive move. Had the price lost touch with the bottom of this channel, a measured move down to $70k could have been the result.
The $BTC price is up against firm resistance, but having just broken back into the channel, plus having broken up through a small descending trendline, there could be enough momentum to take the price through both of the resistances and beyond $84K. Yes, the Stochastic RSI is starting to become overbought in the short 4-hour and 8-hour time frames, but looking at the bottom of the chart, the RSI has also witnessed a breakout in this time frame. The indicator line has pierced through the descending trendline after around a month of downward action. This could perhaps signal some decent upside into the rest of this week.
Can the $BTC price clear the next two resistances?
Source: TradingView
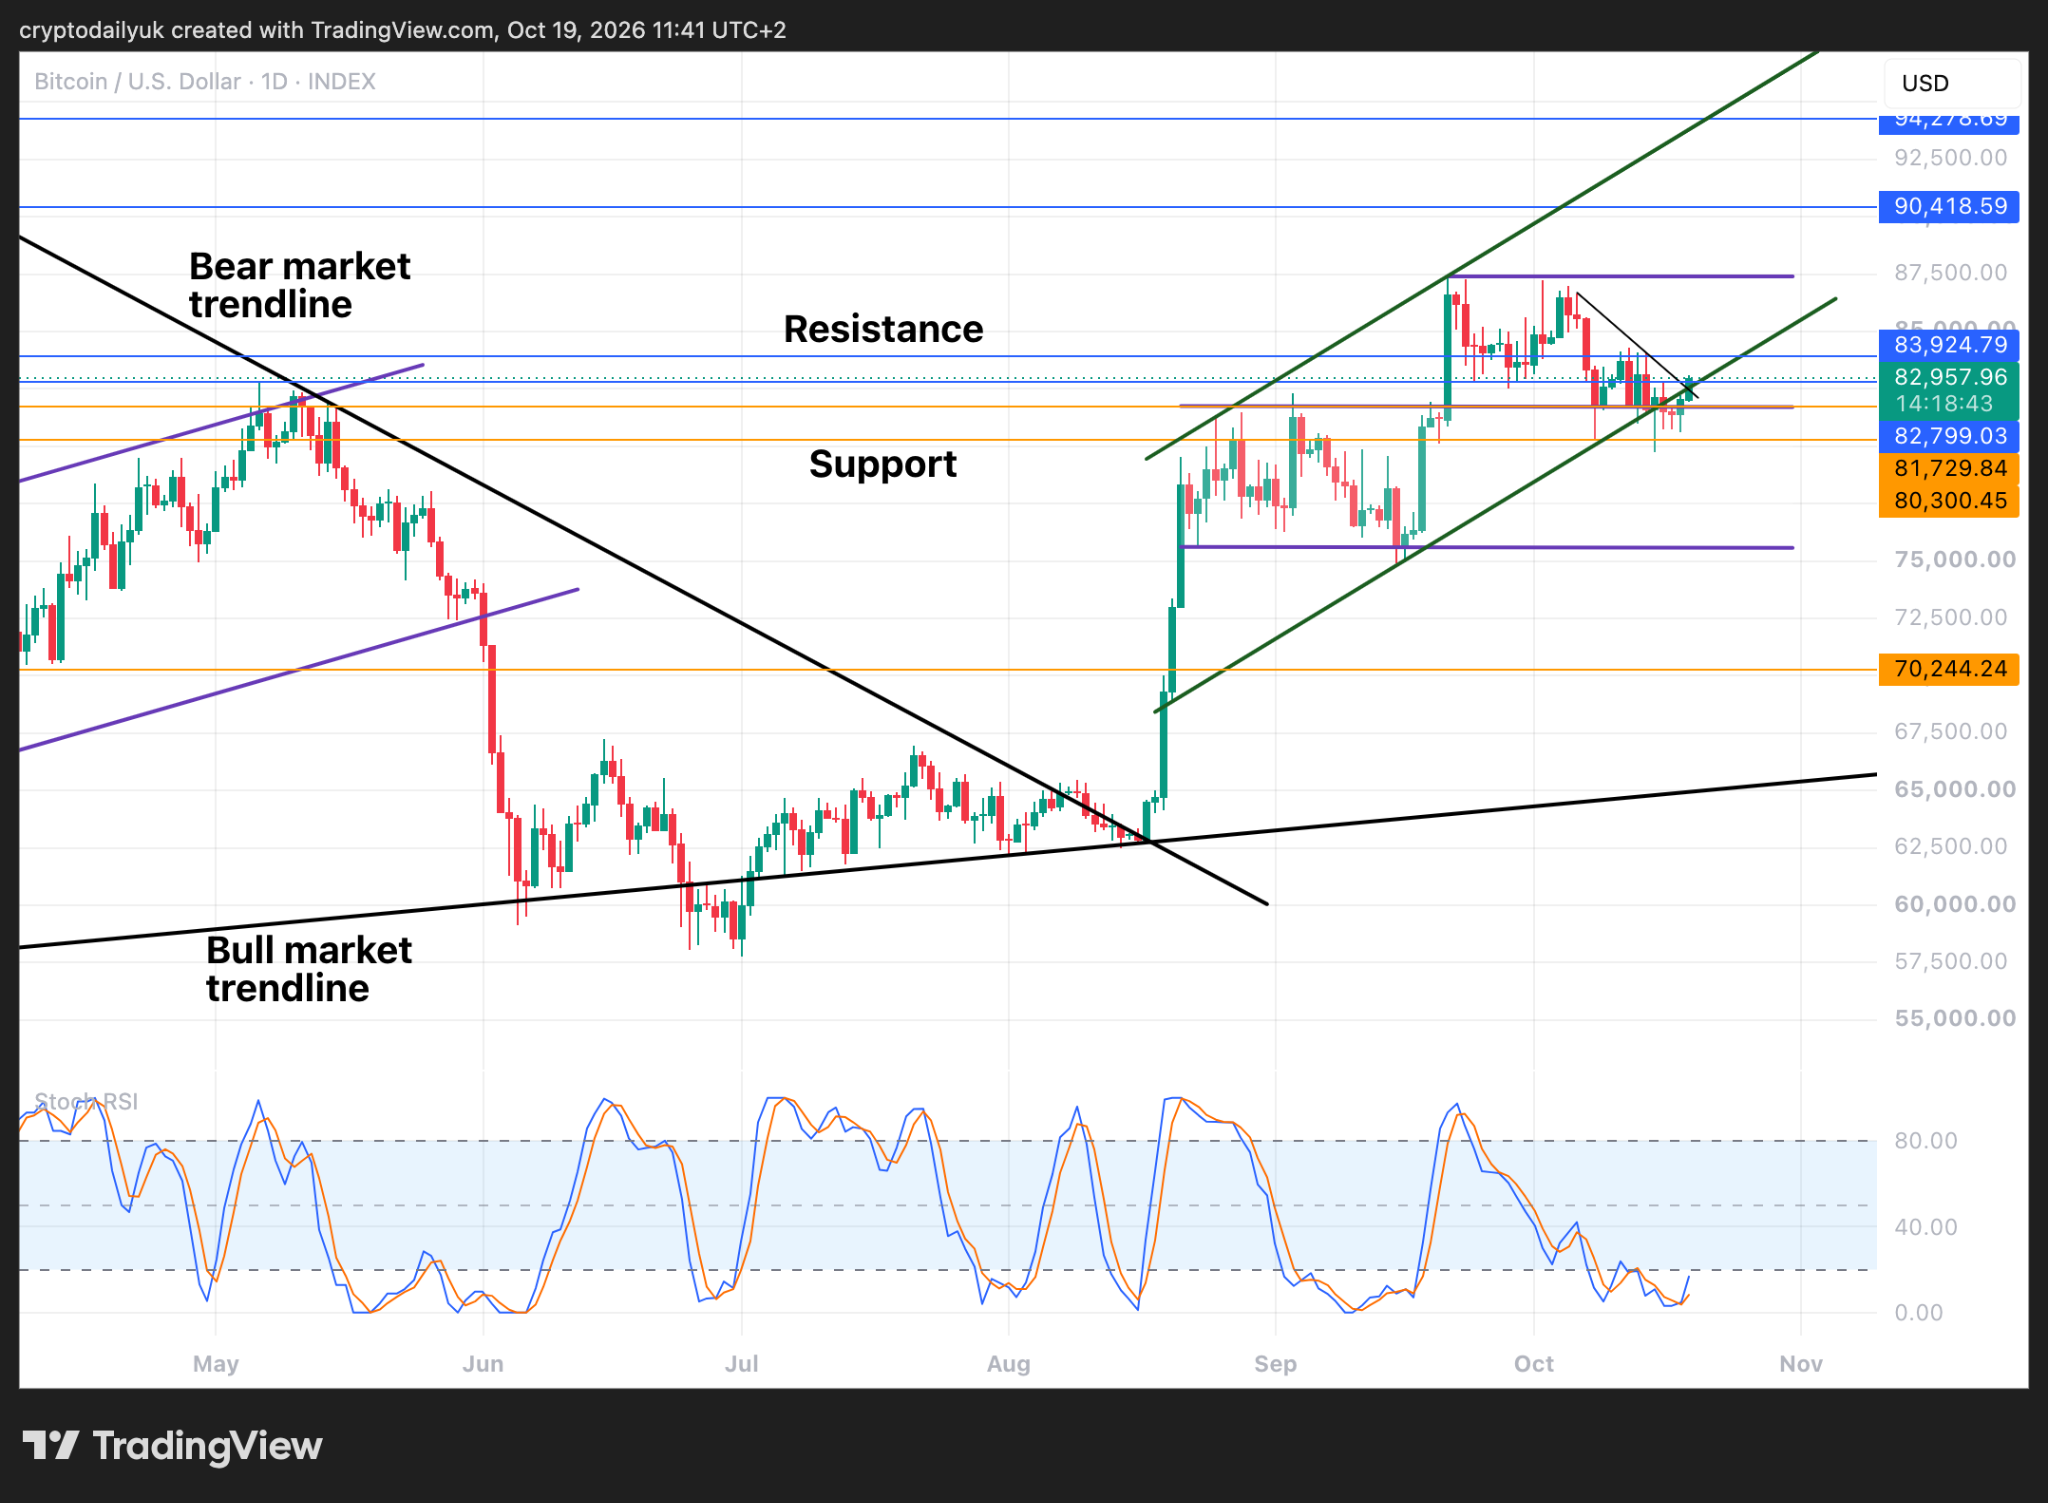
The daily time frame shows that the $BTC price is just starting to pierce up through the first of the resistance levels at $82,800. This is the top of the last big bear flag in the previous bear market, so it will be important to get above and hold this level. If the $84K horizontal resistance can also be taken out, this would leave the path open to the top of the current parallel channel.
While the short-term time frame Stochastic RSIs may be starting to become overbought, out in the daily the indicator lines have only just begun to rise from their bottom limit. If we look left at the last few ascents from the bottom it can be seen that in the main they were very productive signals for the price.
Can the ascending channel hold as a pattern?
Source: TradingView
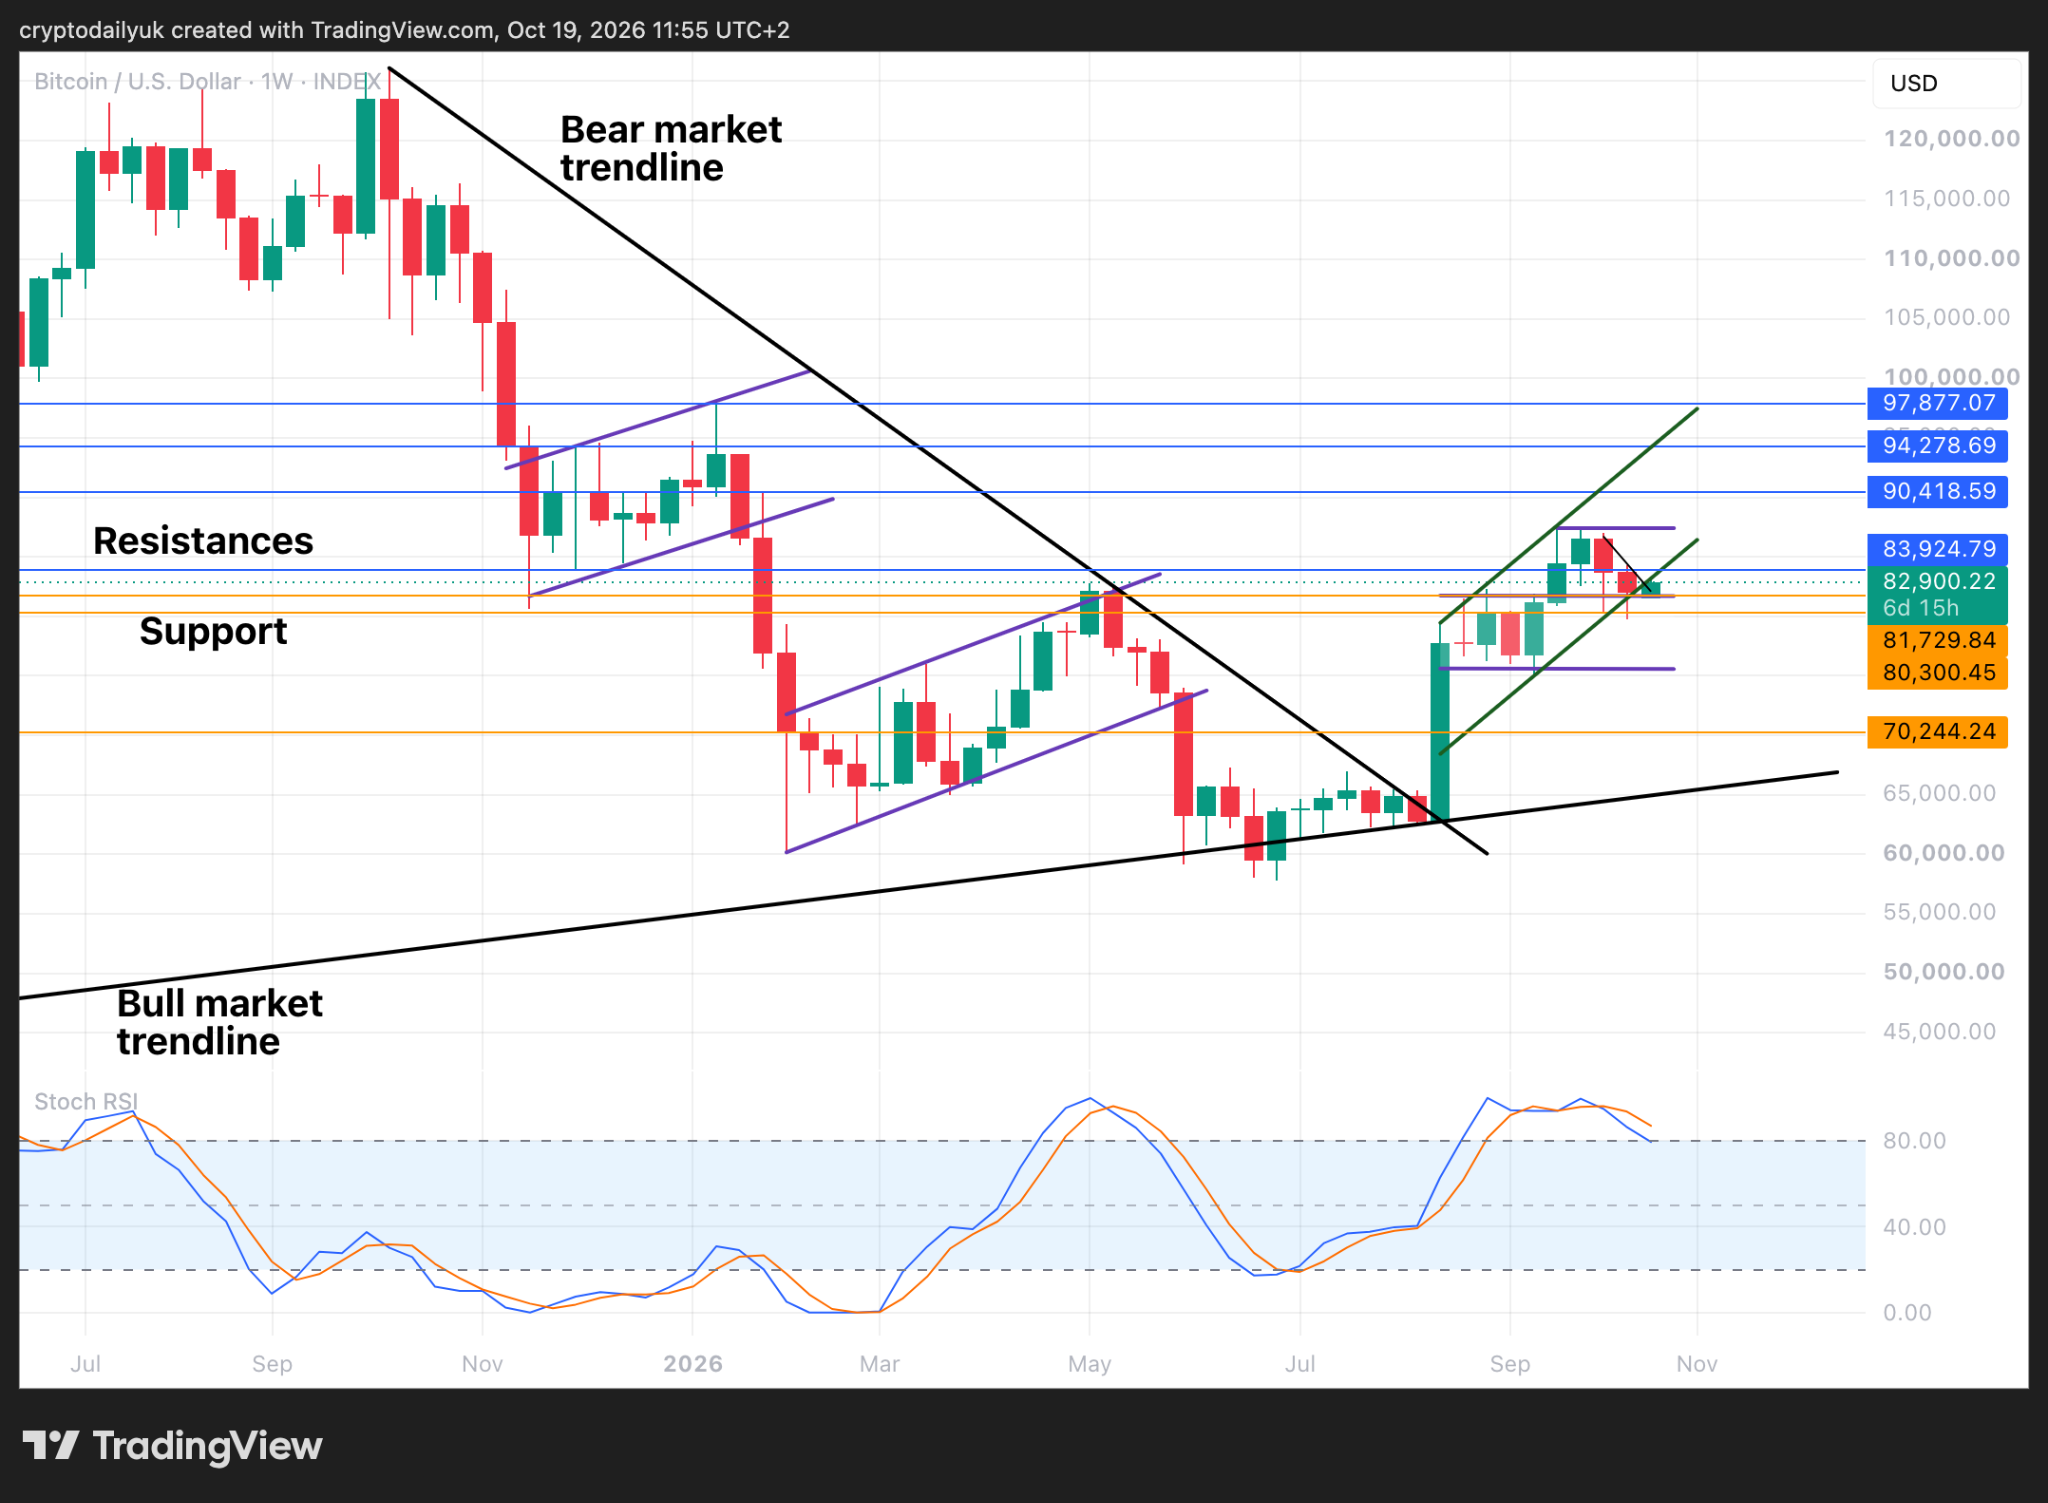
Looking at the macro picture in the weekly time frame it can be seen that as predicted, the weekly candle has been pushed out of the ascending channel, almost by default. The previous candle closed within, but it left no room for the next candle to open inside, and instead this current weekly candle has a job of work to do to not only get back inside the channel, but to rise far enough that the following candle can open within the rising channel and keep the pattern going.
So as it stands, we are left with maybe three alternatives. Either the current candle is a fakeout, and will reenter the channel as already posited, or this is a breakdown candle. If the latter is true, and the present candle closes the week outside the rising channel, the next weekly candle could go a fair bit higher, but only to test and confirm the bottom of the channel as new resistance. The last alternative is that the $BTC price just drops from here and heads down to $80K, or quite possibly down to the low $70K region.
A strong signal would be the Stochastic RSI. If the indicator lines head straight down, passing the 80.00 level, this would favour the drop towards $70K. On the other hand, if they bounce at the 80.00 level, we could have an extension of this upside rally.
Disclaimer: This article is provided for informational purposes only. It is not offered or intended to be used as legal, tax, investment, financial, or other advice.


Be the first to comment