



The Bitcoin bulls were able to push the $BTC price back up to $83K and install it inside its rising channel once again. After around a month of sideways price action can Bitcoin get back on the breakout path, or is a series of lower highs going to continue?
A higher high to reverse the trend?
Source: TradingView

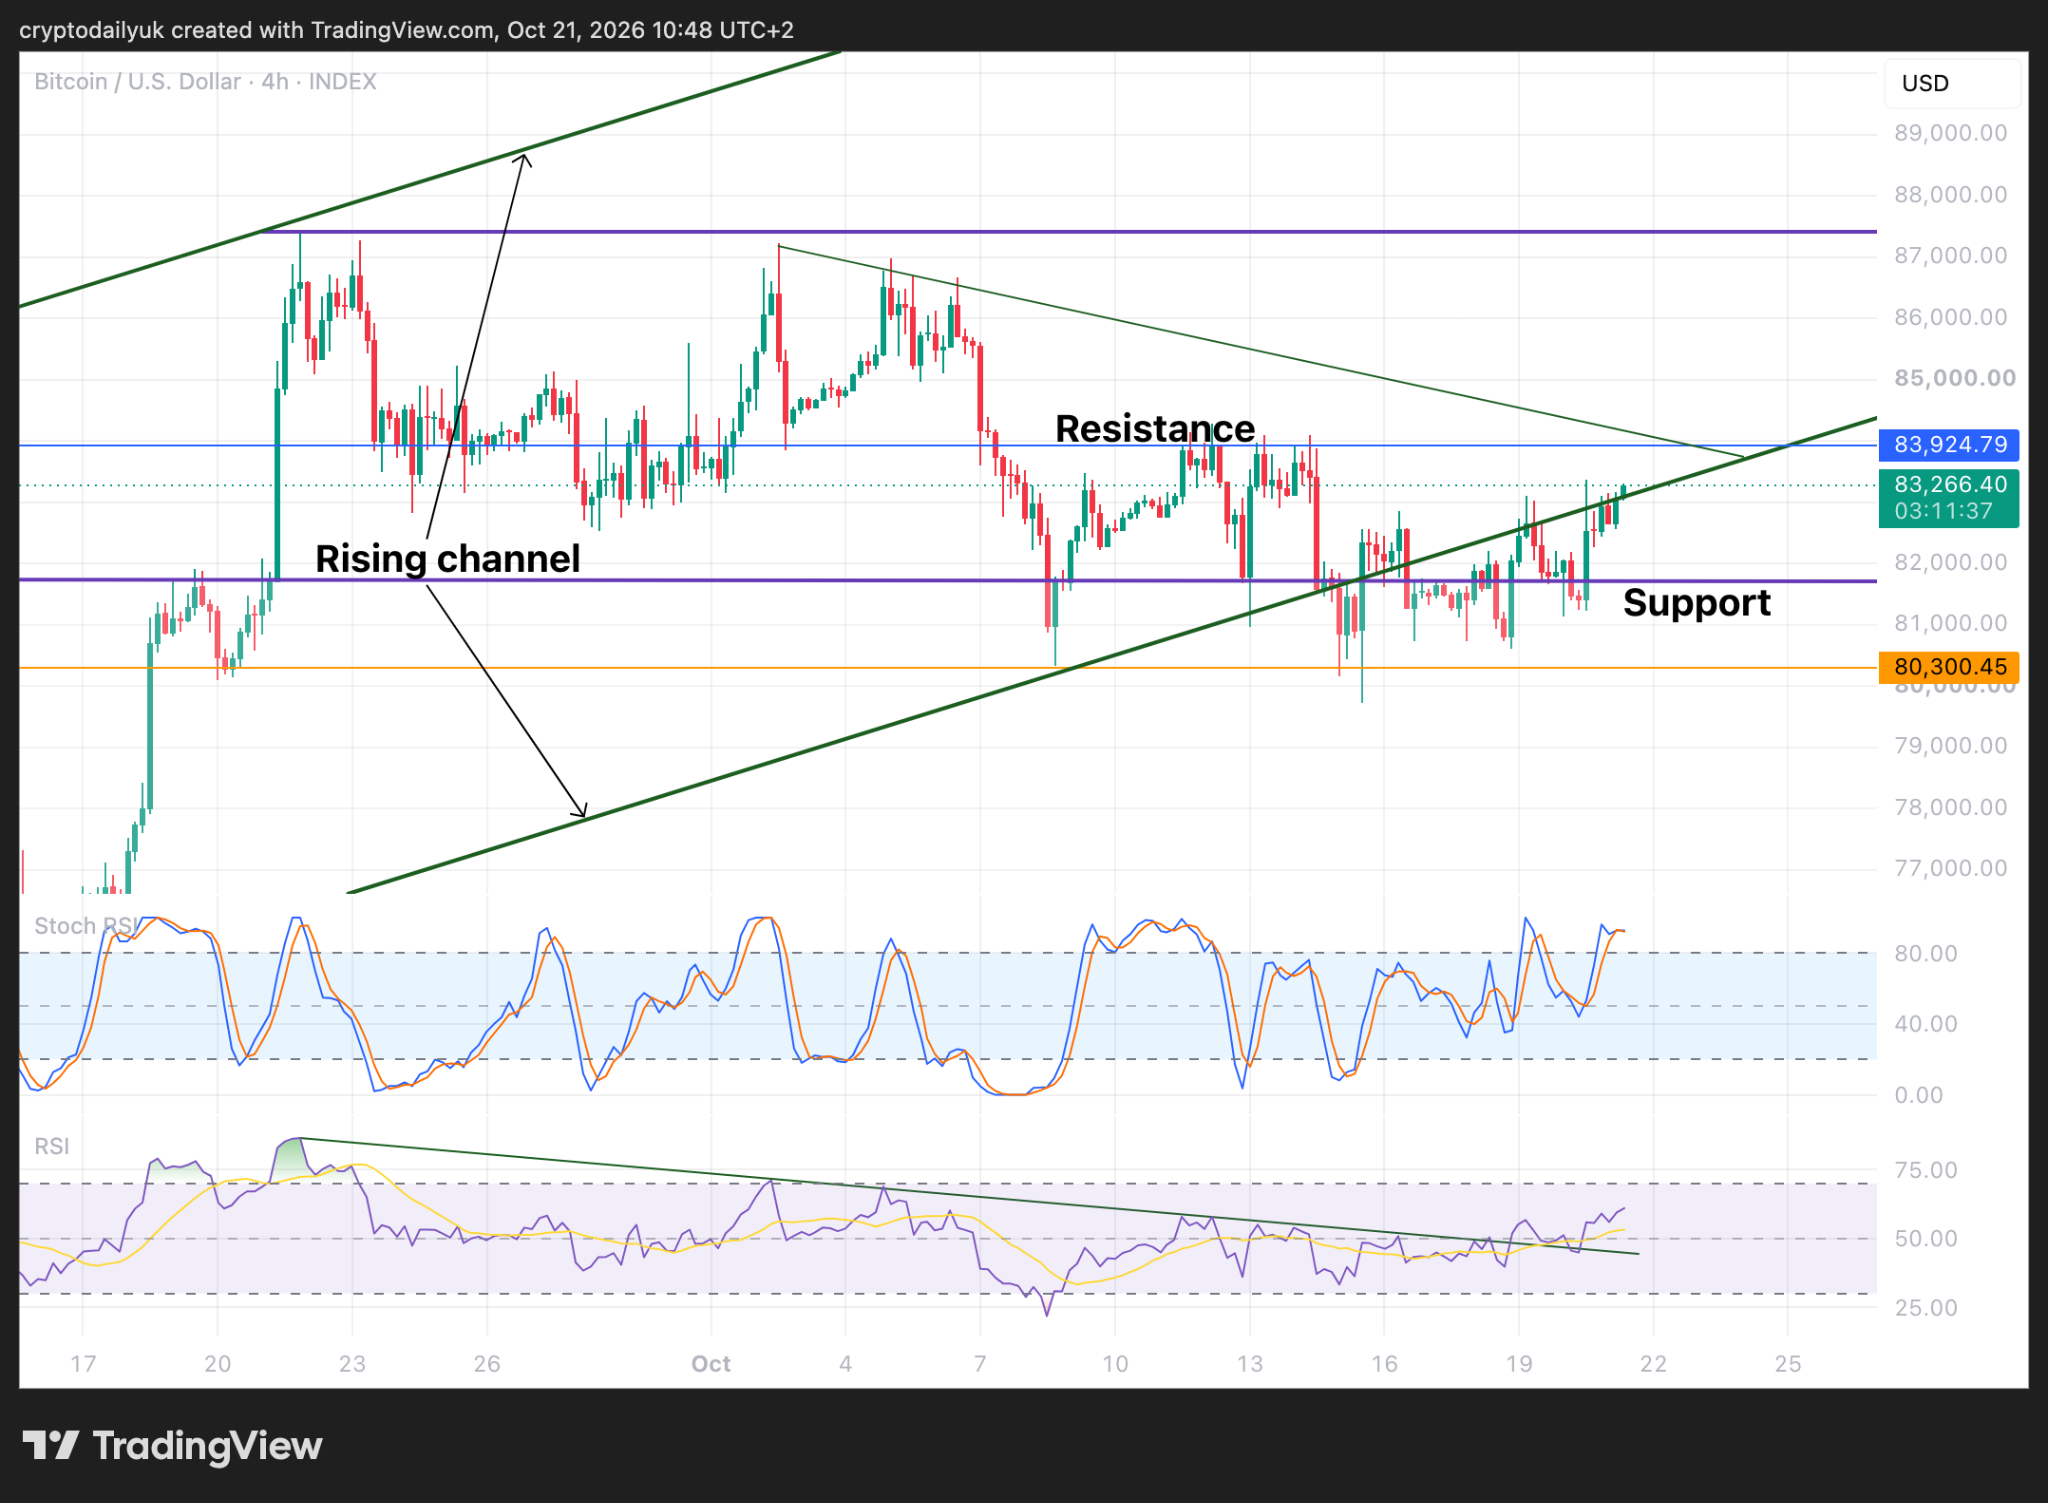
Looking first at the short-term time frame we can see that the $BTC price has just got back into the large ascending channel after spending a couple of days outside and threatening to break down. Could this finally be the moment for a breakout and a much-needed higher high?
The series of lower highs goes right back to the very first high that was made as the $BTC price set the top of the parallel channel, and also touched the top of the ascending channel. It’s been down ever since, but in quite a slow fashion, with each new wave to the upside stopping just short of the height of the previous one. Is this about to happen again? Not only is there firm resistance at $84K, but also a downsloping trendline to add a bit more weight to this resistance.
The indicators at the bottom of the chart suggest that the bulls could do it this time. The Stochastic RSI indicator lines are up in the top section of their limits, while the RSI displays a breakout of a trendline that is a month in the making.
50-day SMA provides the bounce
Source: TradingView
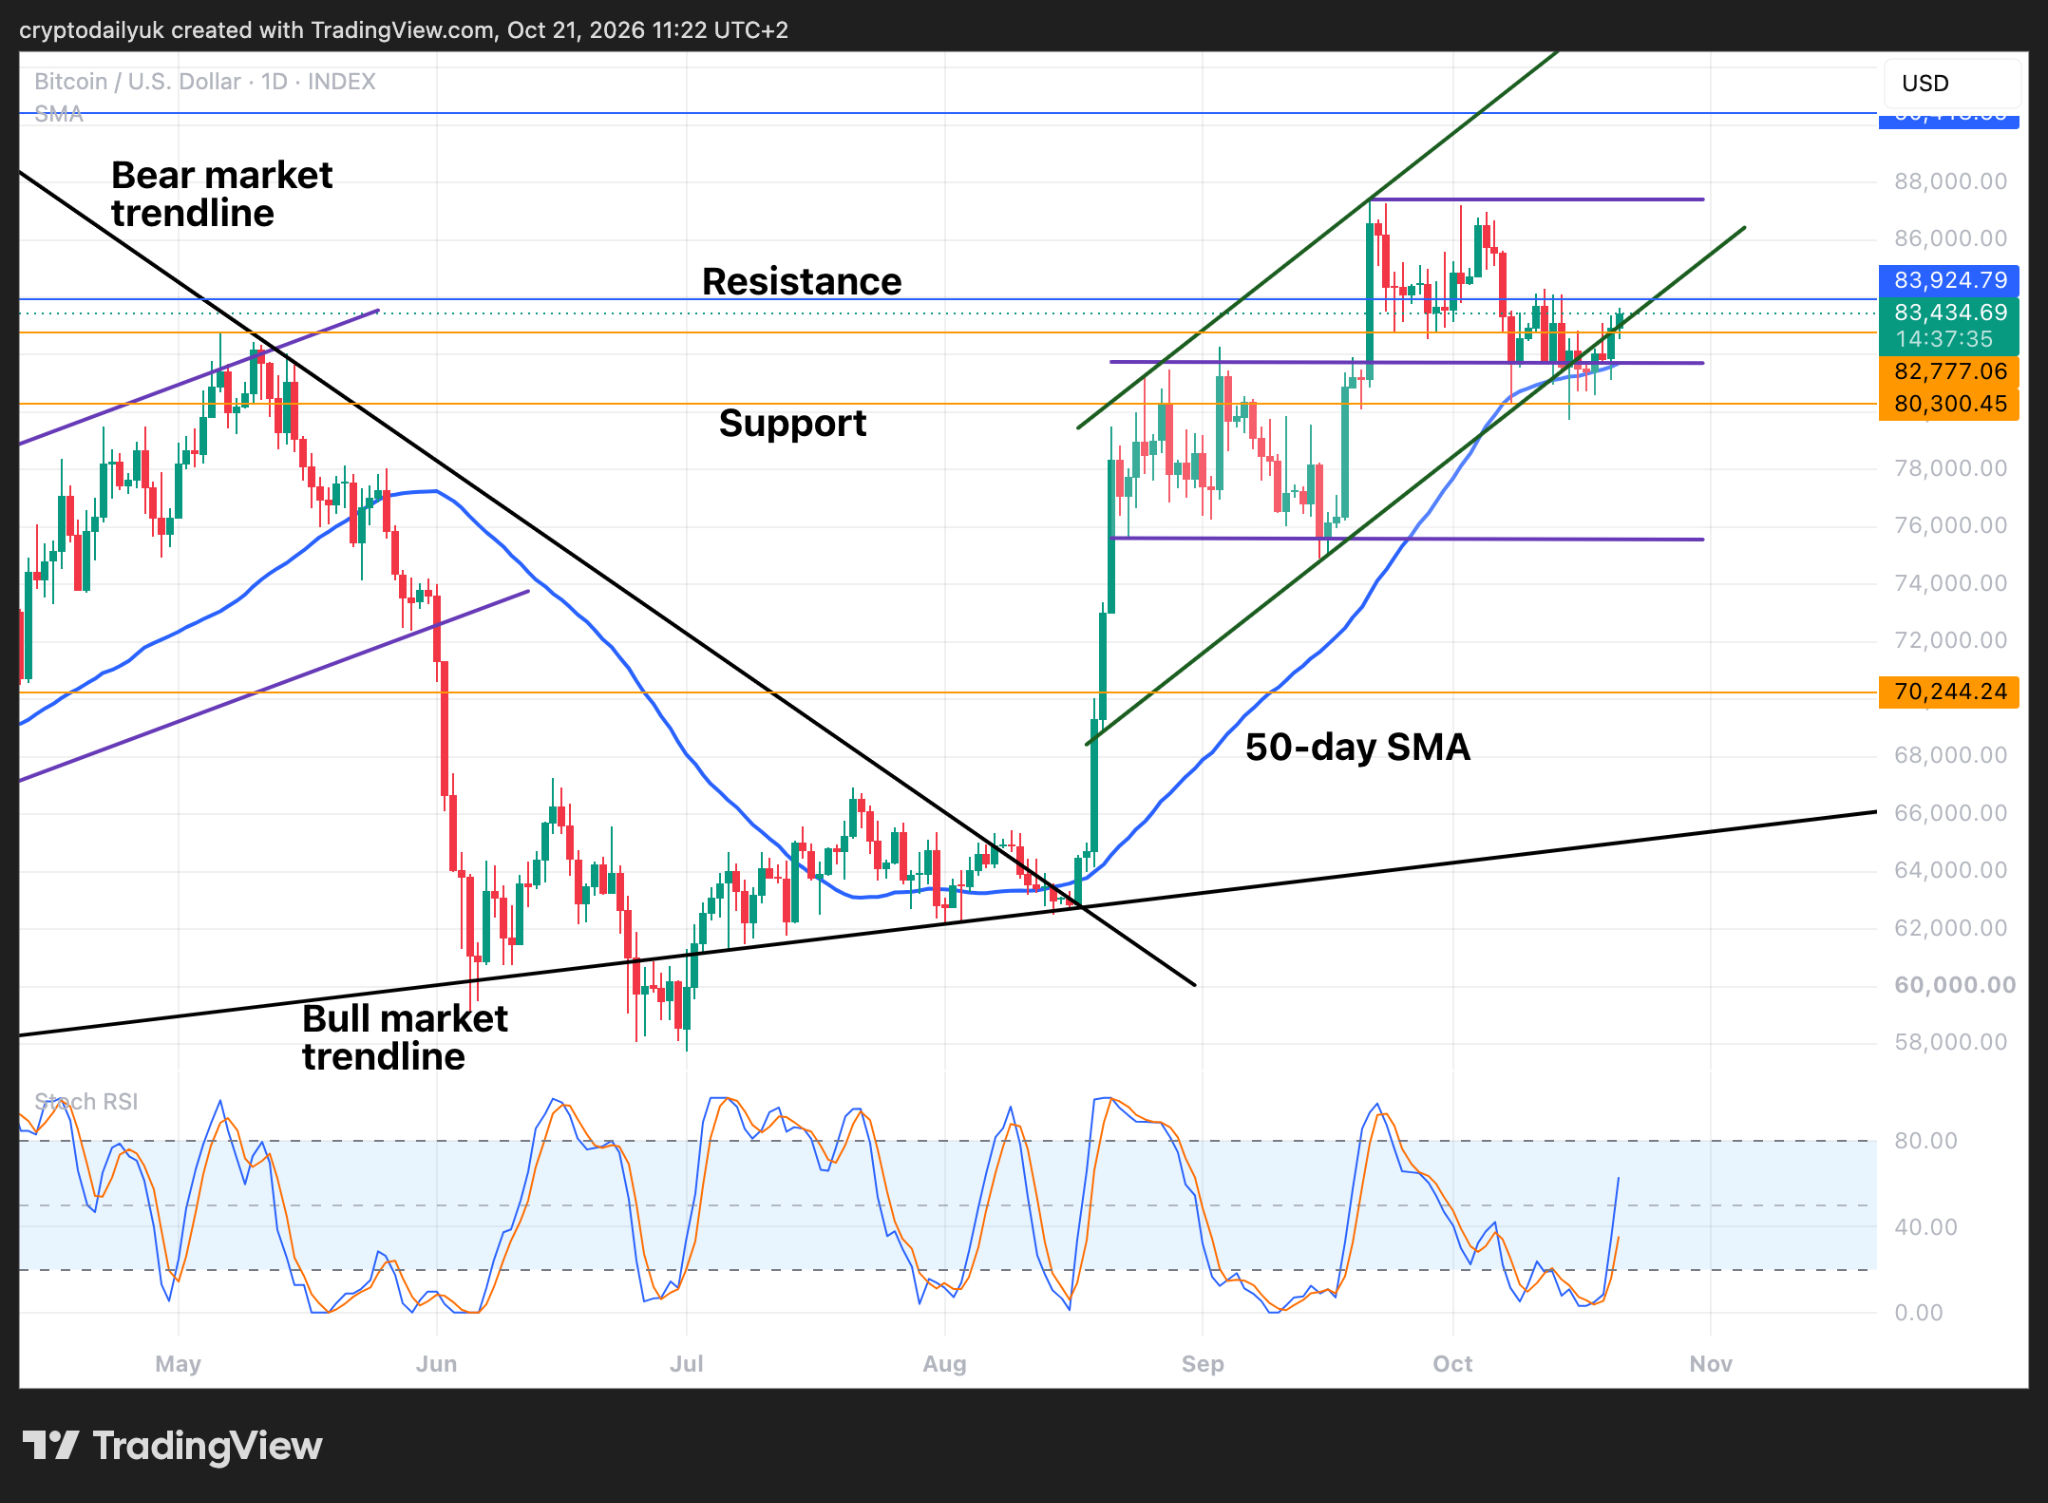
The daily chart is potentially saying that it’s now or never. As well as getting back inside the ascending channel, the $BTC price is also back above the important $82,800 level which marks the top of the last big bear flag of the bear market. This is a trend-changing move, and will need to hold if this current rally is to continue.
The $BTC price has successfully bounced from the 50-day SMA. Whenever a bigger impulse move to the upside is taking place, the price moves clear of this trendline but keeps it close for retests on the way up.
At the bottom of the chart, the Stochastic RSI indicator lines are heading straight up. This is bullishness, and so the bulls need to take advantage of it this time and break out of this parallel channel and head for $90K.
50-week SMA to support the new bull market
Source: TradingView
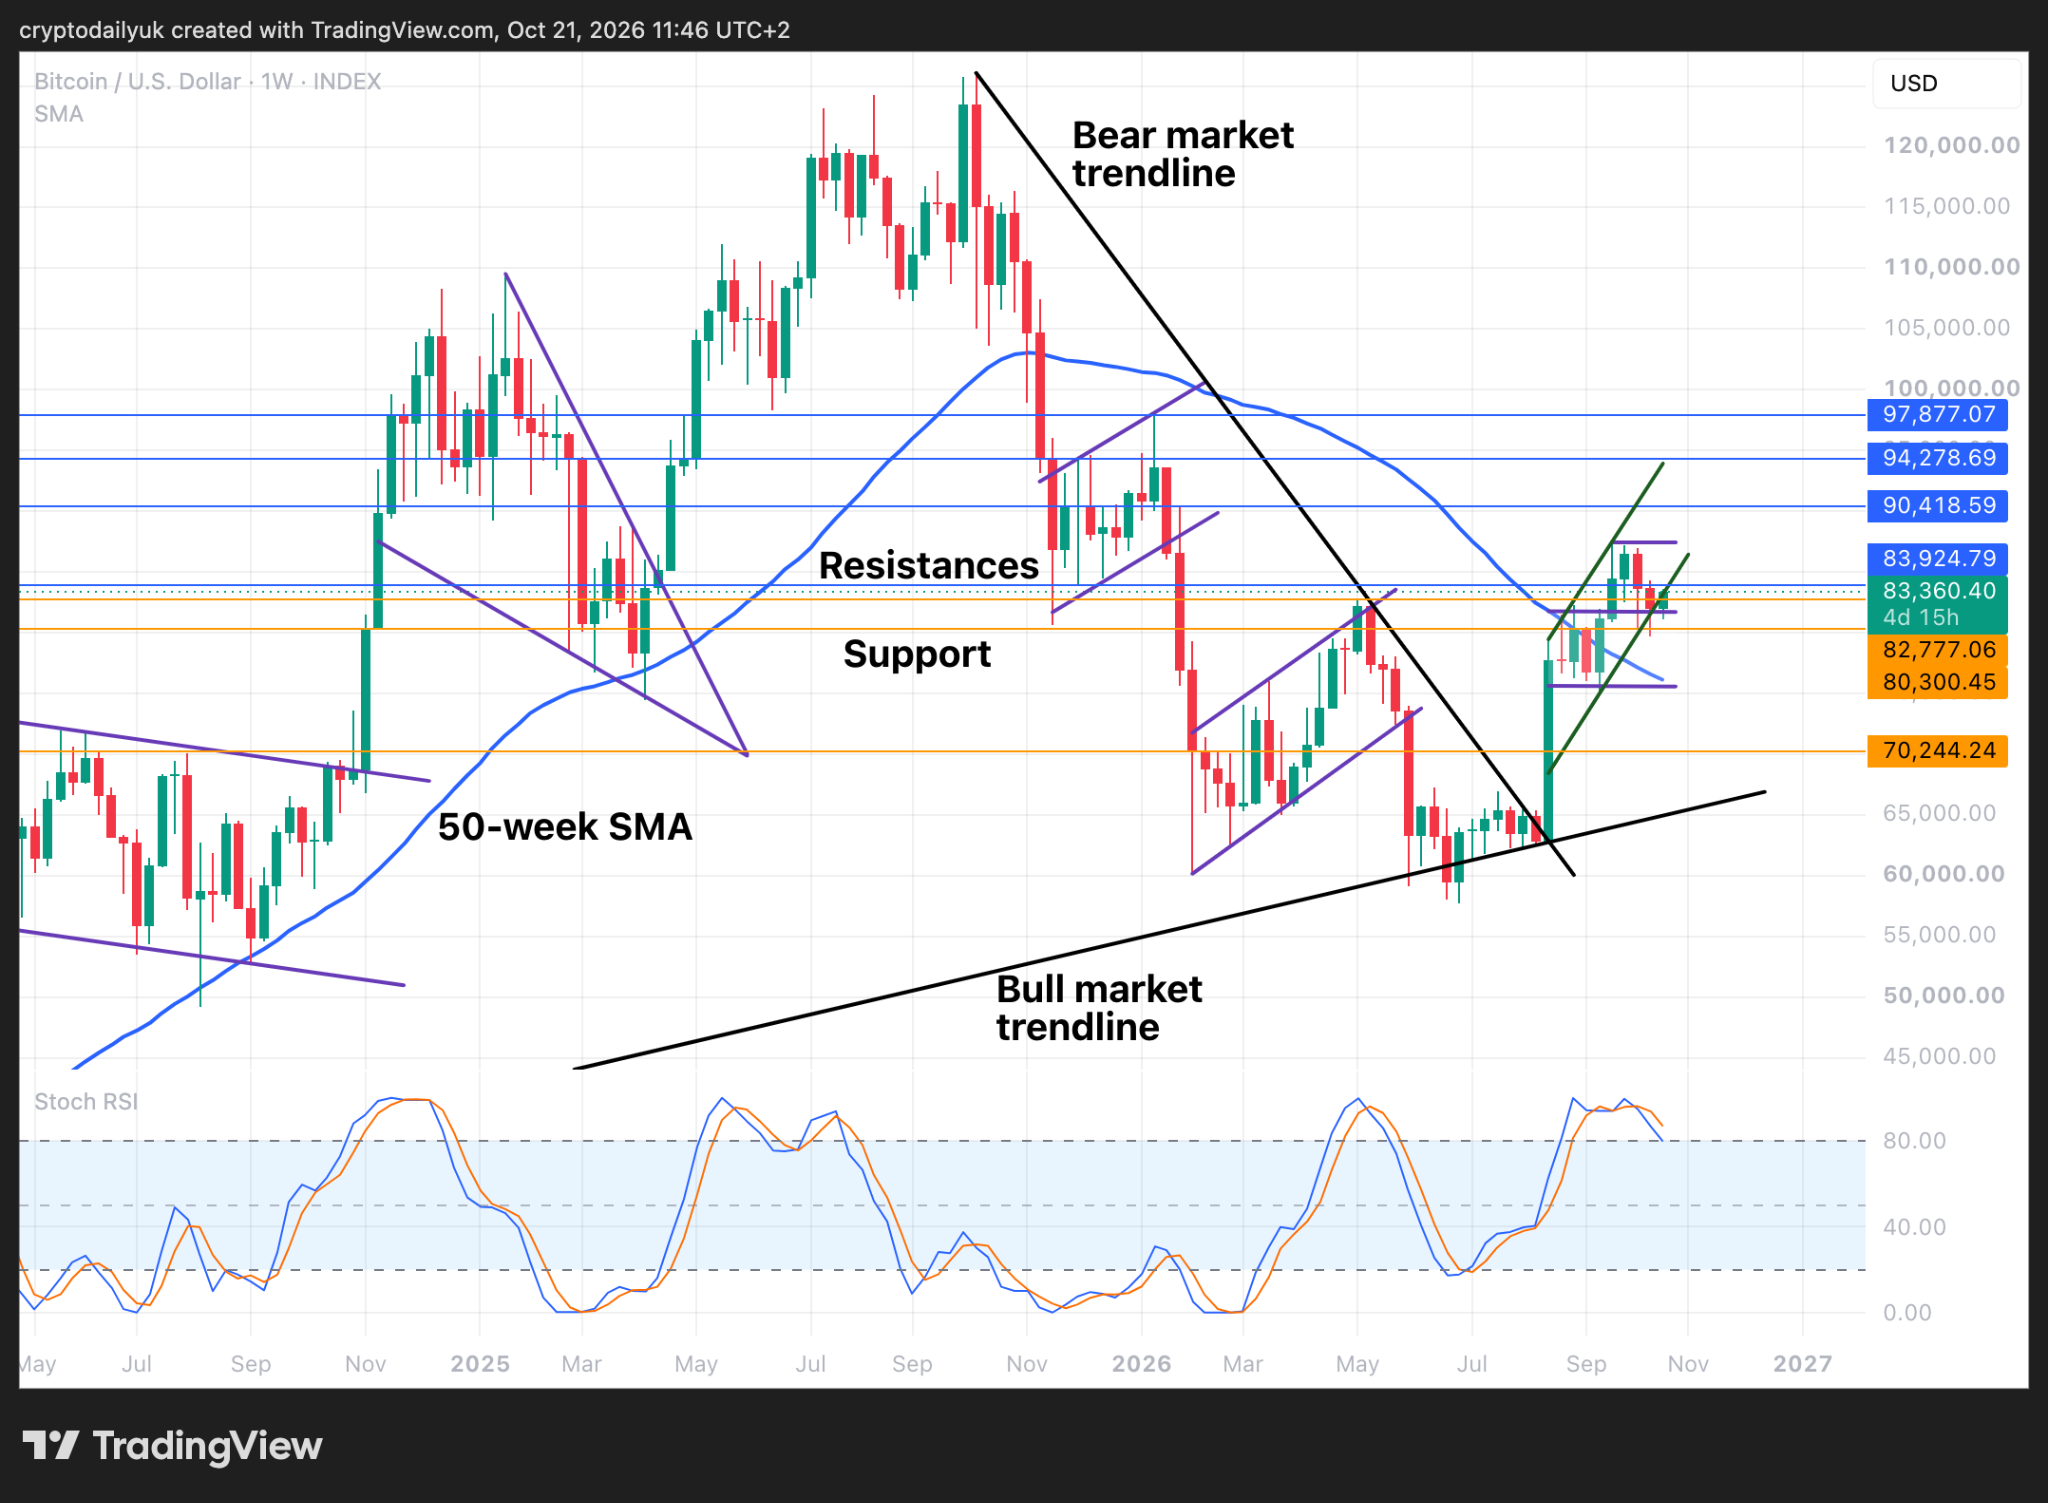
In the weekly time frame we have the 50-week simple moving average (SMA). This has a lot less flexibility than the 50-day SMA, so once it is pointing to the upside, the entire bull market uses it as support, as can be seen in the previous bull market. However, we aren’t there yet. This SMA is still coming down, although the incline is less steep. If we go by the last bear market, the 50-week SMA started to turn up about 6 months after the bear market bottom had been reached. If it is the same case this time, the 50-week SMA could begin its upturn towards the end of December, and we would be 6 months into the new bull market.
Disclaimer: This article is provided for informational purposes only. It is not offered or intended to be used as legal, tax, investment, financial, or other advice.






Be the first to comment