


A bearish shift in the market structure has been confirmed by Bitcoin’s decisive technical breakdown, which has resulted in the rapid loss of several support levels.
After falling below both its 50-day and 100-day moving averages, which had served as dynamic support during the April and May recovery attempt, the asset is currently trading close to $63,000.
The most alarming development is the complete failure of the ascending trendline that supported Bitcoin for almost two months. A significant increase in selling volume has coincided with a full-scale breakdown that started out as a healthy correction. Such an increase in volume during a downturn usually indicates sellers’ conviction rather than transient profit-taking.

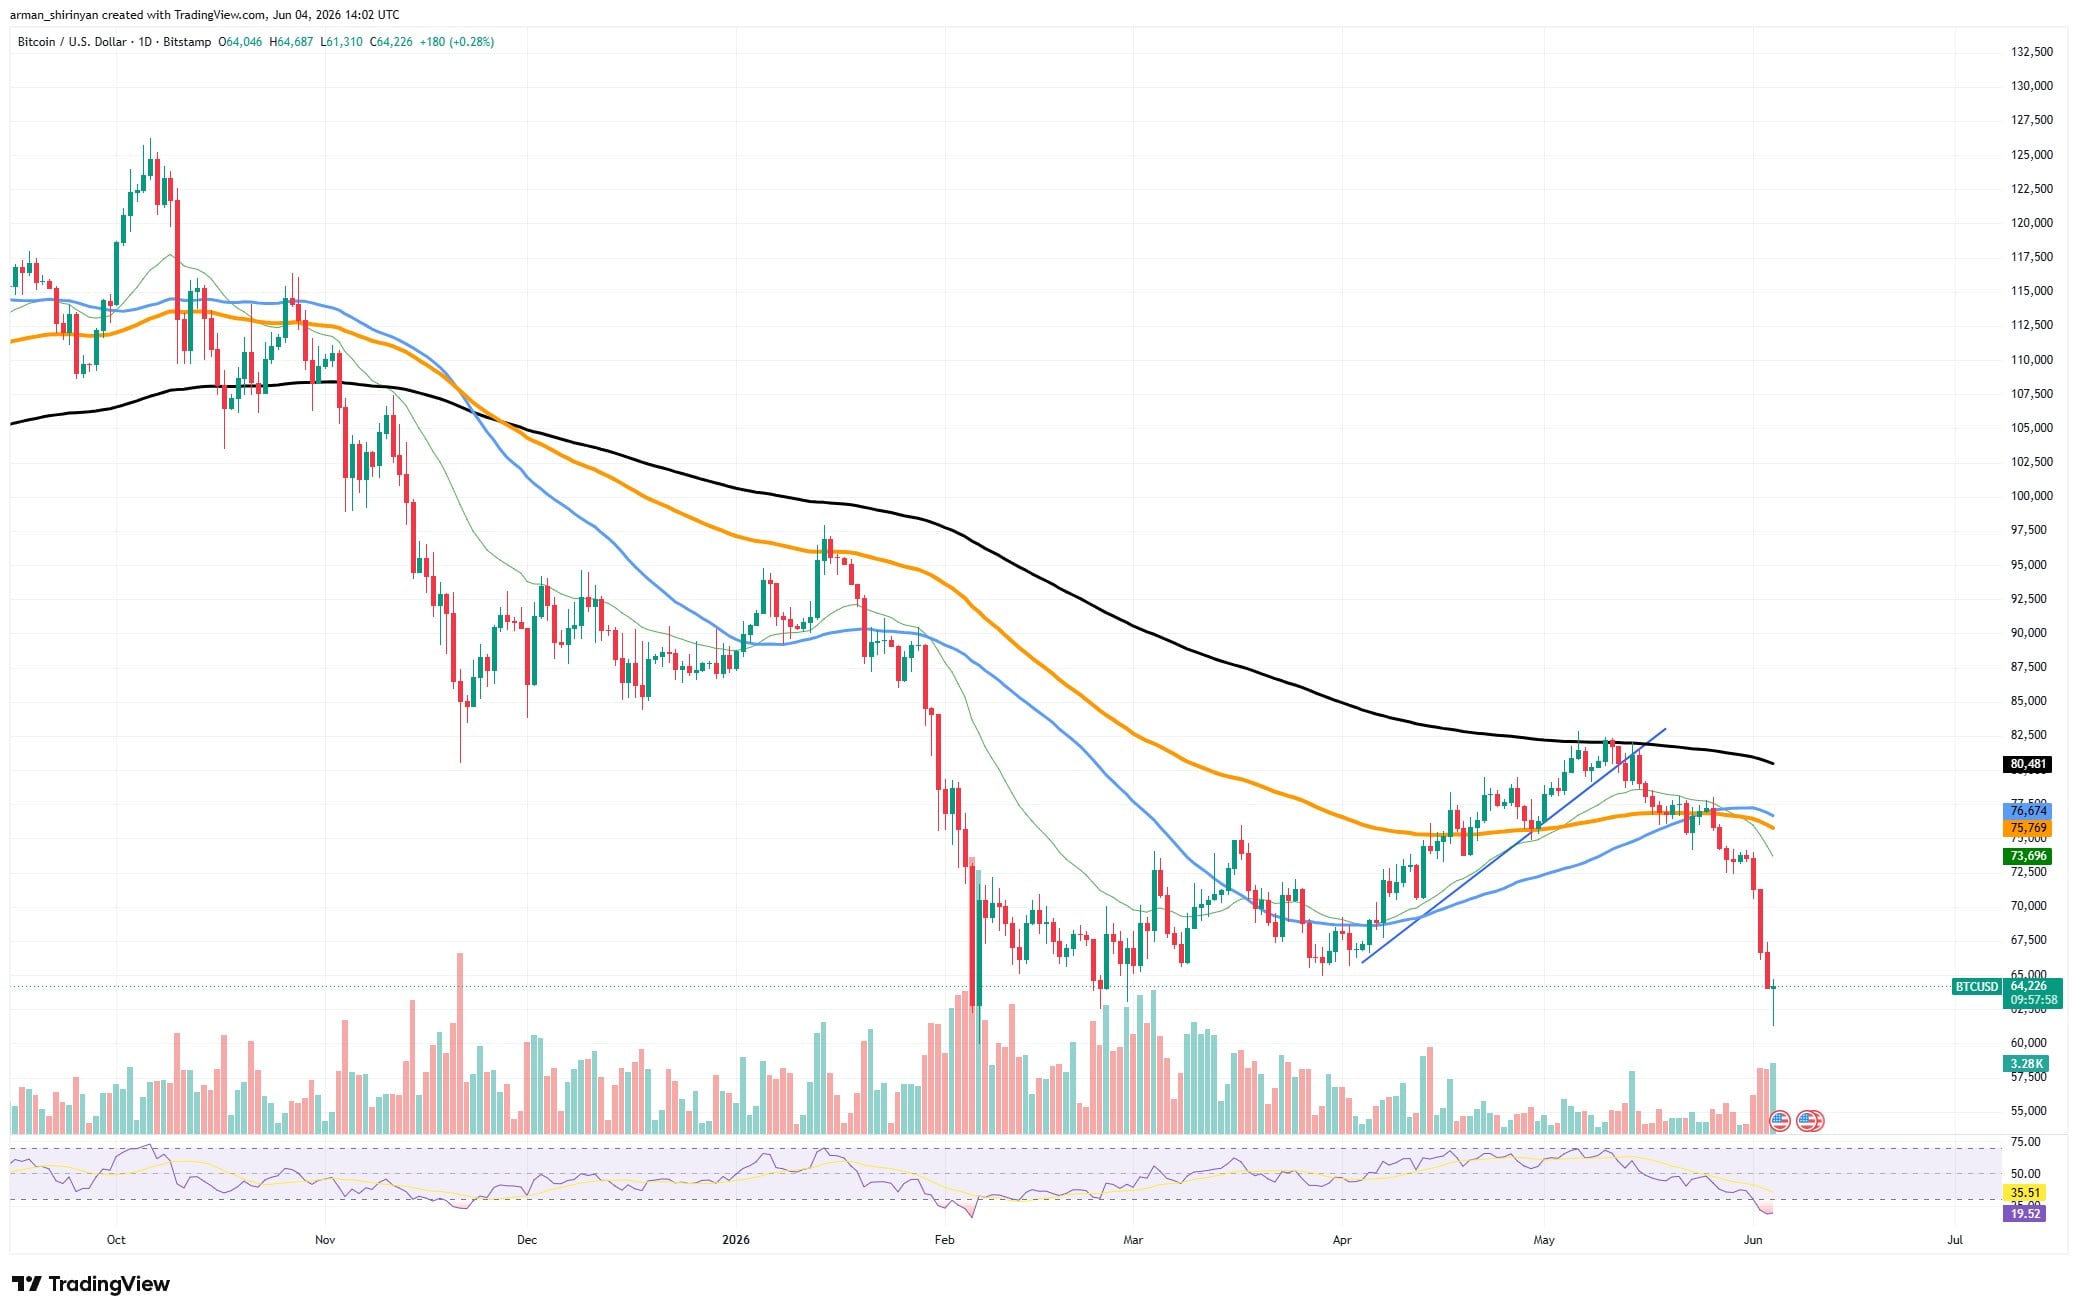
Momentum indicators present a similarly poor picture. With the RSI falling below 20, Bitcoin is in extremely oversold territory. Such readings do not always indicate a final bottom, even though they frequently precede brief relief rallies. Oversold conditions can last far longer than traders anticipate during significant downtrends.
The psychological $60,000 level is the next important area to keep an eye on. Market players may start aiming for the mid-$50,000 range, where demand has historically surfaced, if bears push Bitcoin below that level.
Before discussing a long-term recovery, Bitcoin would need to regain the $73,000-$76,000 range and rise above its major moving averages. The technical outlook is still very negative for the time being. A bounce may result from oversold conditions, but until Bitcoin regains lost support levels, the general trend favors sellers.
Ethereum back at key support
Ethereum is going through a similar collapse, but from a technical standpoint, the damage seems to be even worse. ETH is currently trading around $1,760 after losing support near $2,000, which is one of its worst performances in recent months.
Ethereum’s long-term decline was essentially confirmed by the rejection from the descending resistance line that was visible throughout May. Since then, sellers have kept total control, driving the asset below every significant moving average. The 50-day, 100-day, and 200-day averages are currently stacked above the price in a traditional bearish formation.
You Might Also Like

Alongside the drop, volume has increased, suggesting strong selling pressure rather than a lack of buyers. This is especially crucial because high-volume breakdowns typically result in more follow-through than low-volume pullbacks.
The RSI has fallen to an incredibly oversold reading of 18. Even though this increases the likelihood of a technical recovery, Ethereum is still susceptible to additional declines as long as general market sentiment is unfavorable. If selling pressure continues, there is no reason to rule out a move toward the $1,500-$1,600 range.
For bulls, getting back to the $2,000 level is the top priority. Until then, each rally runs the risk of turning into yet another lower high in an ongoing bearish trend. At these levels, Ethereum might have appealing long-term value, but there is currently little indication on the chart that sellers have completed their work.
XLM’s explosive potential
After an explosive move from the $0.15 area towards $0.30, Stellar has produced one of the strongest breakouts among major altcoins, but the rally is already beginning to show signs of fatigue.
XLM swiftly retraced almost one-third of its gains after the breakout, indicating that traders took advantage of the rally to lock in profits rather than open long-term positions.
You Might Also Like

Stellar’s technical position is still significantly better than that of the majority of large-cap altcoins despite the pullback. The 200-day moving average, which had limited upward attempts for months, was one of the major moving averages that the asset successfully surpassed. There is now more support beneath the market as the 50-day and 100-day averages are rising.
An equally significant story is conveyed by volume. The breakout coincided with a sharp increase in trading activity, indicating that there was genuine demand rather than a squeeze on liquidity. But since volume has already started to decline, Stellar will require new purchasing activity to maintain its recently formed bullish structure.
You Might Also Like

The 200-day moving average and the most recent breakout area are close to the current support zone, which is located at $0.20. Bulls continue to control the broader trend as long as XLM stays above this area. Another try at the $0.25-$0.30 range might be possible if the defense is successful.
The RSI is currently close to neutral levels after cooling from overbought territory. Because it eliminates a portion of the speculative excess that accompanied the initial surge, this is beneficial.
Whether buyers see the recent drop as a healthy reset or the start of a more significant correction is the crucial question for Stellar.
Toncoin’s reset
After failing to capitalize on its explosive May rally, Toncoin is now in a much more challenging position.
TON is currently testing crucial support around the 50-day and 100-day moving averages near $1.75-$1.80 after a sharp surge toward $3.00. Since then, TON has steadily lost momentum.
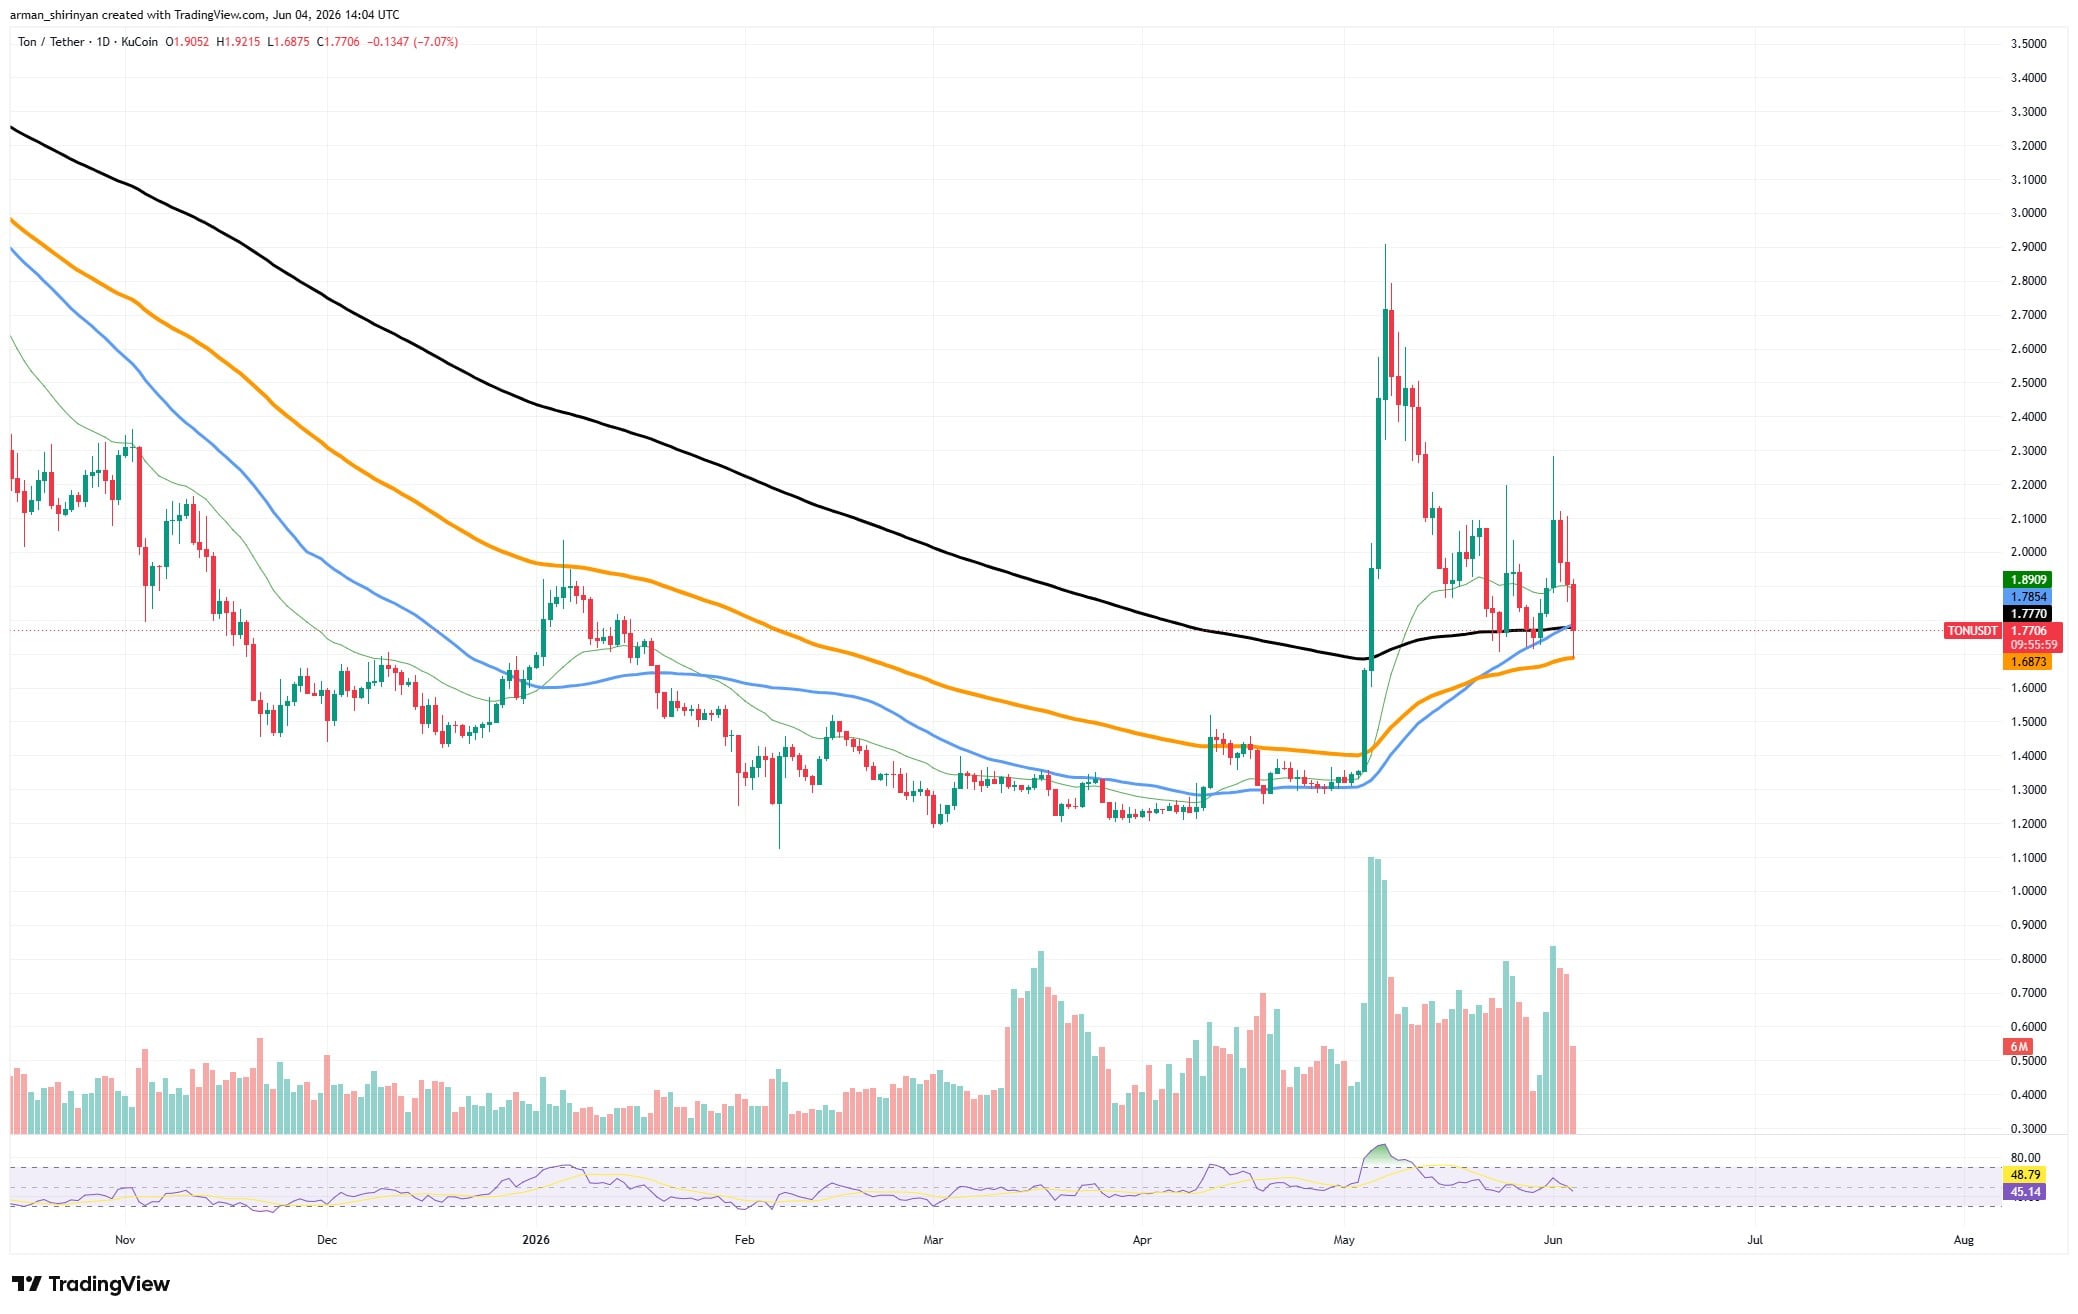
A market caught between opposing forces is evident in the recent price action. Bulls are still protecting moving-average support, but aggressive selling has thwarted every attempt at a rally. The frequent rejection in the $2.00-$2.10 range indicates that traders are still reluctant to push the asset higher until a more distinct trend appears.
TON is especially susceptible because of the fading volume profile. Although there was a lot of participation during the initial breakout, subsequent rebounds have happened on lower volume, suggesting a decline in buying conviction. This frequently comes before another leg lower or prolonged consolidation.
You Might Also Like
The longer-term structure has not entirely collapsed, which is good news for bulls. TON is still trading well above the lows set earlier this year and above its 200-day moving average. But there is less room for error.
Toncoin may swiftly return to the $1.50 region, where higher demand previously surfaced, if the support around $1.75 fails. On the other hand, recovering $2.00 would greatly boost sentiment and might lead to a return to the $2.40-$2.50 range.
TON seems to be in a wait-and-see phase right now. Much of the speculative excitement surrounding the earlier rally has already been absorbed by the market, and whether buyers can hold onto the current support levels will probably determine the next significant move.

Be the first to comment