




TLDR
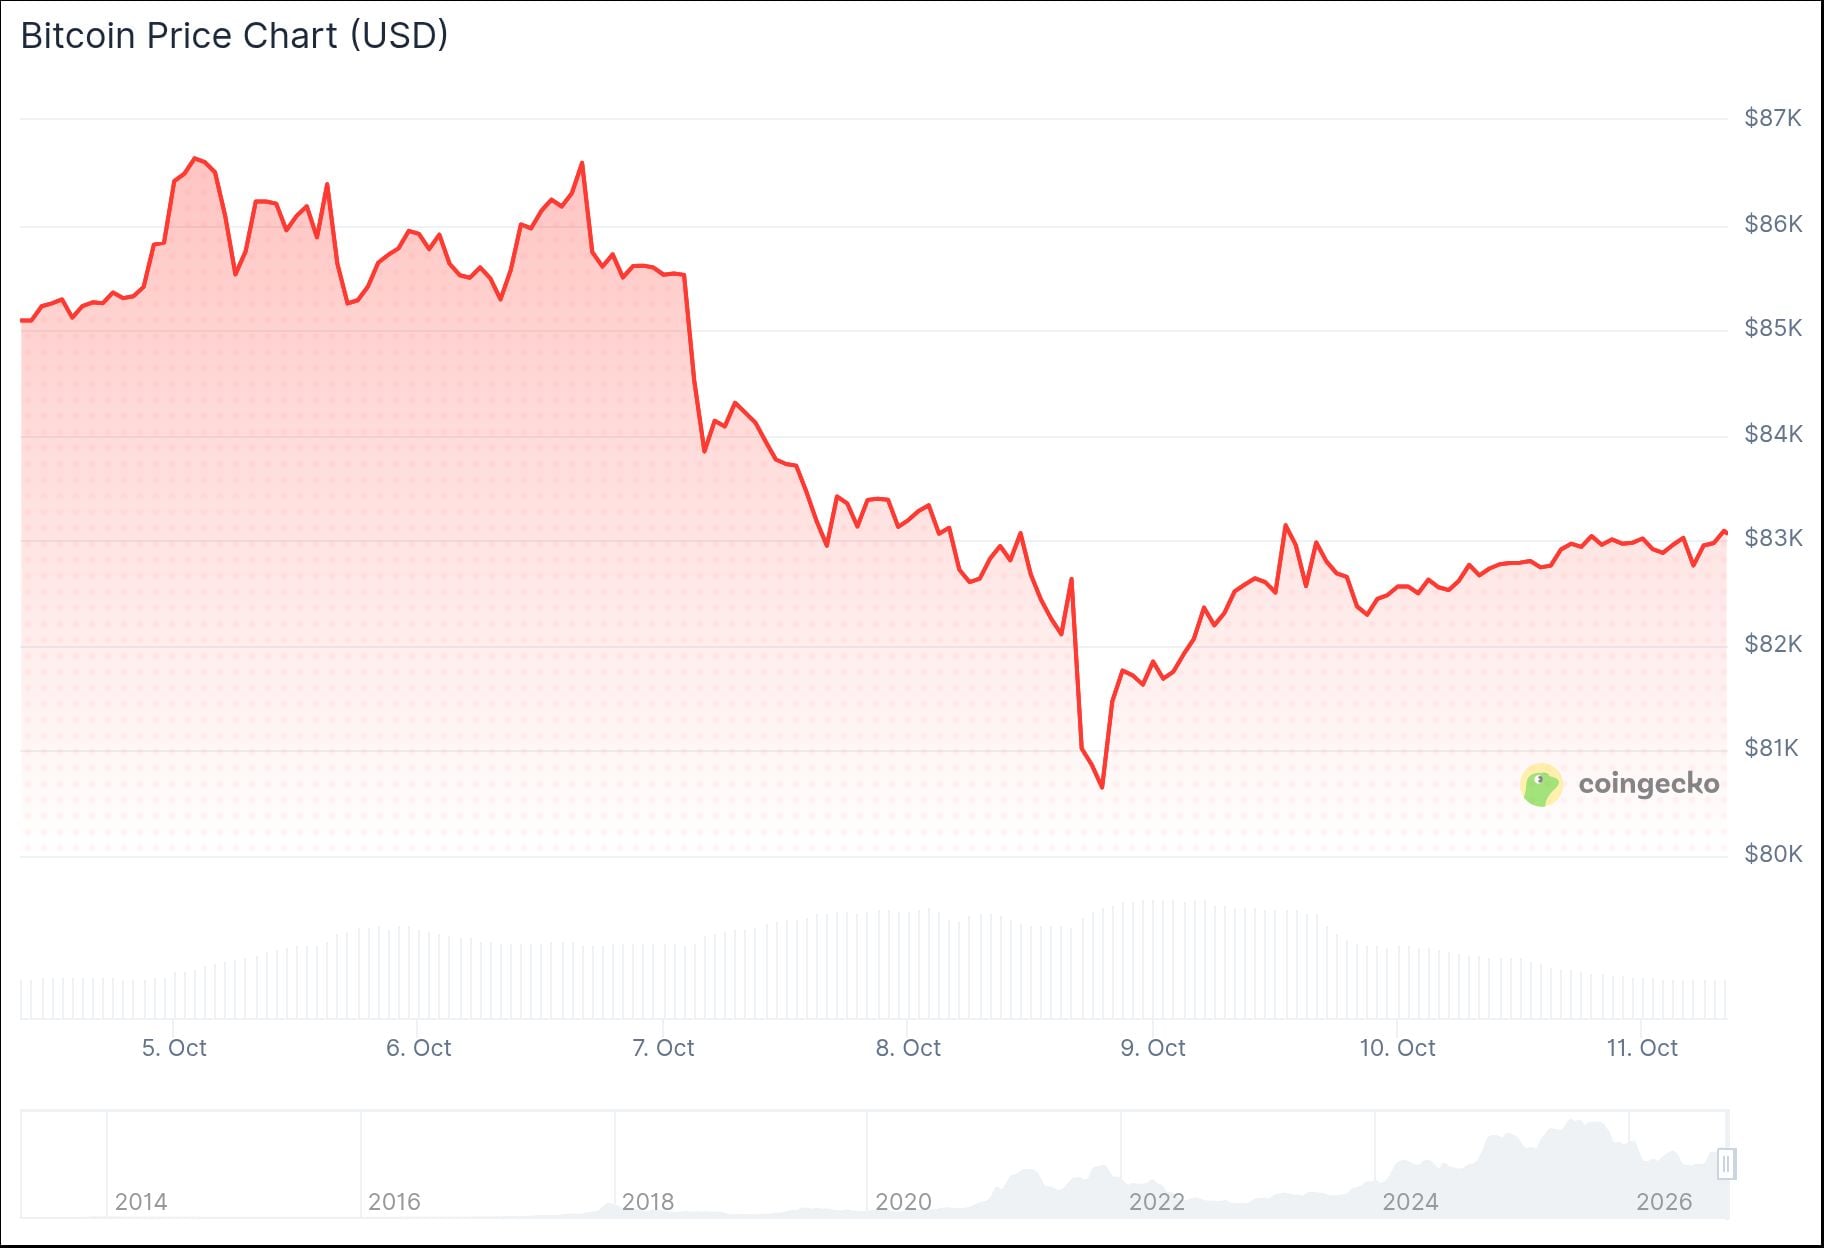
- Bitcoin trades near $83,049 on the Oct. 11 daily chart, inside a range of roughly $80,315 to $87,397.
- U.S. spot Bitcoin ETFs saw a $21.1 million net inflow on Oct. 9 after two days of outflows.
- RSI sits at 52.06, while MACD is below its signal line, showing softer momentum.
- Citi raised its 12-month Bitcoin target to $113,000 on Oct. 1.
- Analyst BATMAN says $35M+ in sell walls sit between $85K and $89K.
Bitcoin is trading around $83,049 on the Oct. 11 daily Coinbase chart. The price is holding above the lower end of a consolidation zone after a rally from the August lows. BTC opened near $82,911, rose to about $83,071, dipped to $82,714 and then settled slightly higher.
The chart shows Bitcoin boxed in between about $80,315 and $87,397. Price remains above the rising trendline from the August breakout. Momentum has cooled after the move from the mid-$60,000s into the mid-$80,000s.
Analyst Daan Crypto Trades said Bitcoin is fighting for the $83K level. He noted that weekly closes above it would be good for bulls in the short term. He also pointed to the daily 200MA and 200EMA, which are rising by about $100 a day.
$BTC Fighting for that $83K level. Weekly closes above would be good for the bulls in the short term.
Below we see the Daily 200MA/EMA moving up. Generally right after a big breakout from a bear trend you do test these at some point later in the trend. At this moment they are… https://t.co/8dZajPK1SO pic.twitter.com/K7pfrO5aA4
— Daan Crypto Trades (@DaanCrypto) October 10, 2026
According to Daan Crypto Trades, price often tests these averages after a big breakout from a bear trend. They tend to offer initial support. He added that the daily 200EMA could catch up with price in about two months, even if price stays flat. These averages also rejected price in May.
ETF Flows and Macro Backdrop
ETF flows remain a main short-term driver. Farside Investors data shows U.S. spot Bitcoin ETFs took in $21.1 million on Oct. 9. That followed $244.1 million of outflows on Oct. 8 and $484.9 million on Oct. 7.
BlackRock’s IBIT led Oct. 9 with $22.4 million of inflows. Fidelity’s FBTC saw a $3.6 million outflow. Cumulative net inflows across U.S. spot Bitcoin ETFs stand at about $57.2 billion.

Flows have been uneven over the past week, which fits the sideways price action. Earlier this month, ETF demand helped push Bitcoin toward the mid-$80,000s. Steady inflows could help a retest of the range top.
Reuters reported that markets are heading into the IMF-World Bank meetings in Bangkok. Higher interest rates, elevated debt concerns and Middle East tensions are in focus. Rising Treasury yields and energy-price swings have also weighed on risk assets.
Citi raised its 12-month Bitcoin target to $113,000 on Oct. 1. The bank cited stronger crypto activity, a supportive macro backdrop and a slower return of ETF inflows. It expects about $5 billion of inflows over the next 12 months.
Chart Analysis
The RSI reads 52.06, which is close to neutral. The MACD line is near 864.74, below the signal line at 1,419.06, and the histogram is about -554.32. This points to softer momentum while price holds its structure.
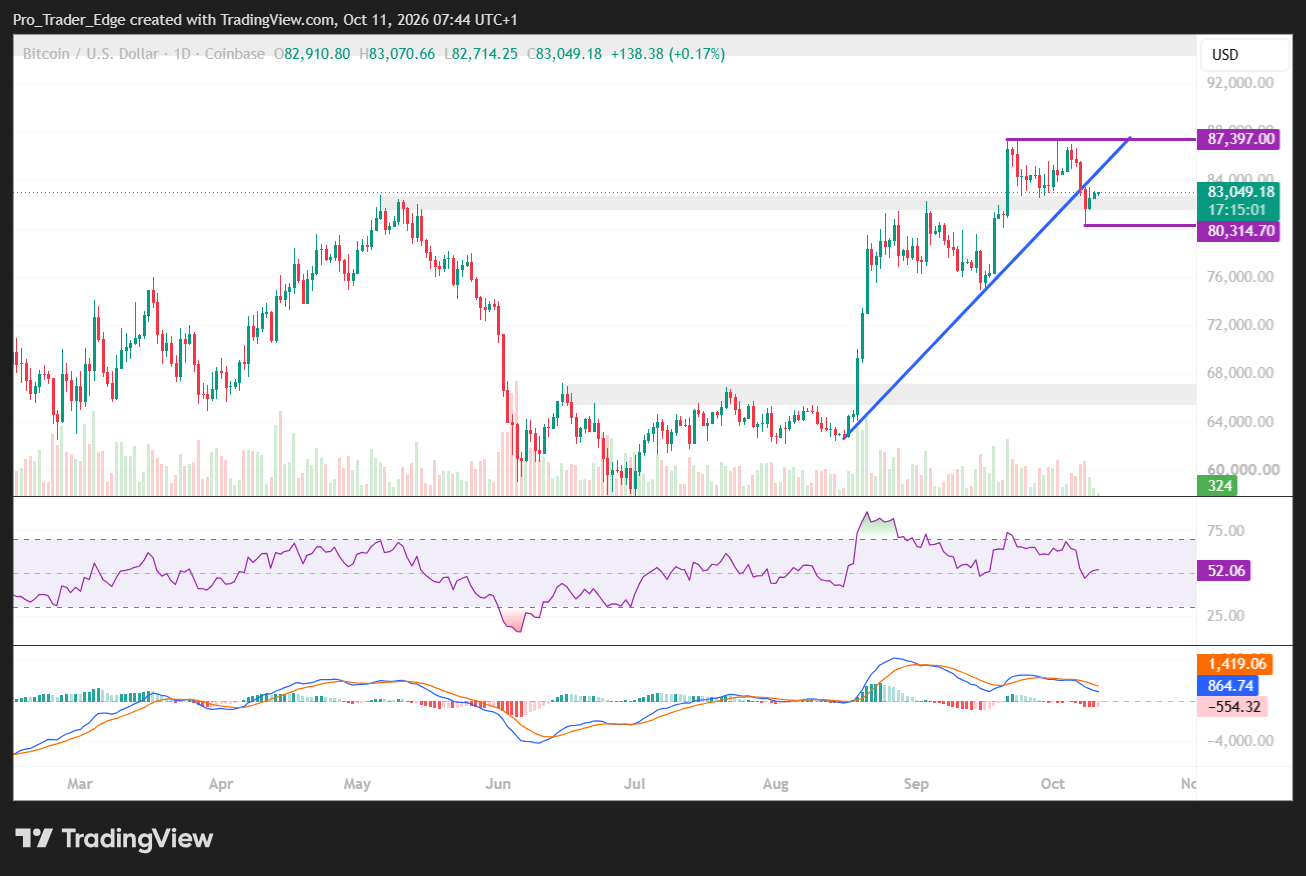
The first level to watch is $80,315, the range floor. A decisive loss could pressure the rising trendline and open a move toward the high-$70,000s. On the upside, watch $87,397, where a breakout would bring higher resistance zones into view.
Analyst BATMAN said Bitcoin has $35M+ in sell walls stacked between $85K and $89K. He said bulls need to absorb that supply to unlock the next leg higher. He added that the real battle starts at $85K.
$BTC has $35M+ in sell walls stacked between $85K and $89K.
Bulls need to absorb that supply to unlock the next leg higher. The real battle starts at $85K. pic.twitter.com/lWwlUEQp6E
— BATMAN ⚡ (@CryptosBatman) October 10, 2026
On Oct. 9, ETF flows turned positive for the first time in three sessions, and Bitcoin continues to trade near $83,000.



Be the first to comment