




TLDR
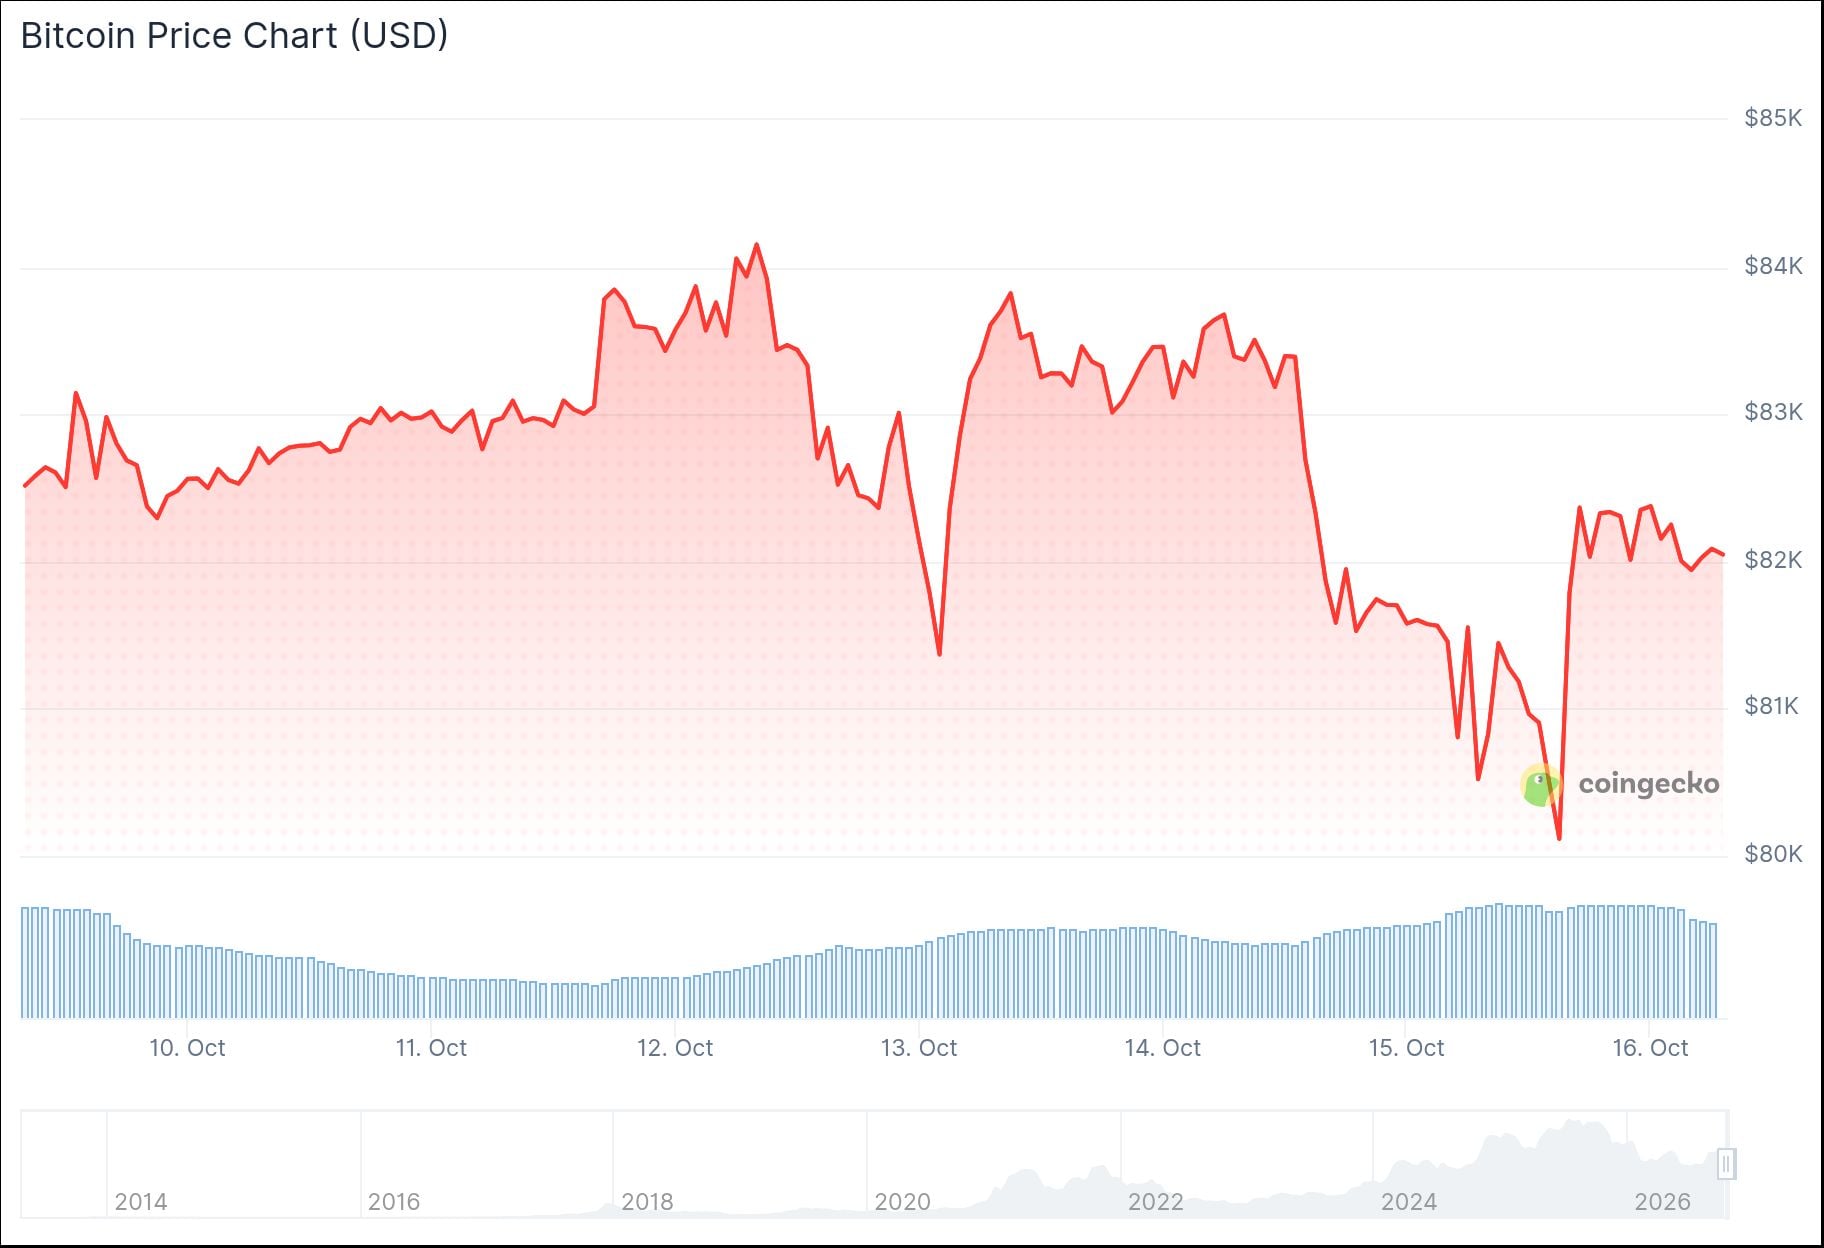
- Bitcoin briefly fell below $80,000 on Thursday after September US producer prices rose 1.3%, the largest monthly gain since March 2022.
- Annual PPI hit 6.3% against a 5.3% forecast, and core PPI reached 5%.
- CME FedWatch put the odds of an October Fed rate hike at about 34%.
- Analysts Ted Pillows, Rekt Capital and Aksel Kibar are watching levels from $75,000 to $83,700.
- Bitcoin has rebounded to about $82,000.
Bitcoin (BTC) fell below $80,000 on Thursday after US producer inflation came in higher than expected. The price later recovered and now trades near $82,000.
The Bureau of Labor Statistics said the September Producer Price Index rose 1.3% from August. That was the largest monthly gain since March 2022.
Annual producer inflation reached 6.3%, against a forecast of 5.3%. Core PPI rose to 5%, compared with an expected 4.4%.
The report followed Wednesday’s consumer price data, which showed inflation at 3.7%. Bitcoin dropped about 3.6% over 24 hours at one point.
Energy Prices Drive the Jump in Producer Inflation
The BLS said energy caused more than 80% of the rise in goods prices. Energy rose 10.8%, and gasoline jumped 20.3%.
Services prices rose 0.8% in September. Excluding food, energy and trade services, prices rose 0.5% for the month.
CME FedWatch put the odds of a quarter-point Fed rate hike at the Oct. 27-28 meeting at 34%. Reuters reported odds of about 30%.

Treasury yields fell despite the data. Former Goldman Sachs strategist Robin Brooks said yields have decoupled from macro data as markets focus on the federal deficit.
Analyst Ash Crypto said Bitcoin first dropped $4,000 after the PPI and CPI data, liquidating over $800 million in longs. It then bounced to $82,000, liquidating $50 million in shorts within 60 minutes.
This is absolutely insane.
Bitcoin first dropped by $4000 after PPI and CPI came in higher than expected, liquidating over $800 million in longs.
But just when bears thought they had control, BTC bounced back to $82,000, liquidating $50 million in shorts in just 60 minutes.… pic.twitter.com/TkeVkoOzIl
— Ash Crypto (@AshCrypto) October 15, 2026
Analysts Watch Key Support Levels
Analyst Ted Pillows said the move from $79,700 to $82,300 came mostly from short squeezes, with spot buyers barely showing up. He called $81,200 the line to hold on the daily close and said a break of $83,700 with spot buying would give the bounce more strength.
Last update before I go to sleep. $BTC bounced from $79.7k to $82.3k, but spot buyers barely showed up.
Most of the move came from shorts getting squeezed and perp traders chasing.
Since 18:00, spot has been a net seller every hour.
There’s no real US bid either. The Coinbase… https://t.co/7DD1lpMoXD
— Ted (@TedPillows) October 15, 2026
Rekt Capital said Bitcoin could retest the 21-week and 50-week EMAs at $76,144 and $78,459 and keep its bullish trend. He noted such dips have happened in early-stage bull markets.
Analyst Aksel Kibar said last week’s close near $83,700 lacked strength as a breakout. He named $75,000 as the level that would negate the rectangle pattern.
The one-hour TradingView chart shows Bitcoin falling to its lowest level since Sept. 18 before rebounding. The weekly chart shows price above the 21-week and 50-week EMAs, with no bullish crossover yet.
Bitcoin remains below the $82,500 to $82,800 support zone. The level to watch next is $82,800, the top of that zone.
Bitcoin is trading near $82,000 at the time of writing.



Be the first to comment