




TLDR
- Bitcoin trades near $83,893 on Oct. 12 and remains inside a range between $80,314 and $87,397.
- U.S. spot Bitcoin ETFs saw $484.9 million in net outflows on Oct. 7, after $118.8 million in inflows the day before.
- CPI data is due Wednesday, with PPI and retail sales due Thursday.
- RSI sits at 55.13, while MACD remains bearish in the short term.
- Coin Bureau and Ash Crypto both point to signs of a bullish recovery.
Bitcoin is trading near $83,893 on the Oct. 12 daily Coinbase chart. The price opened around $83,678, reached a high near $84,200 and dipped to $83,354 before recovering.
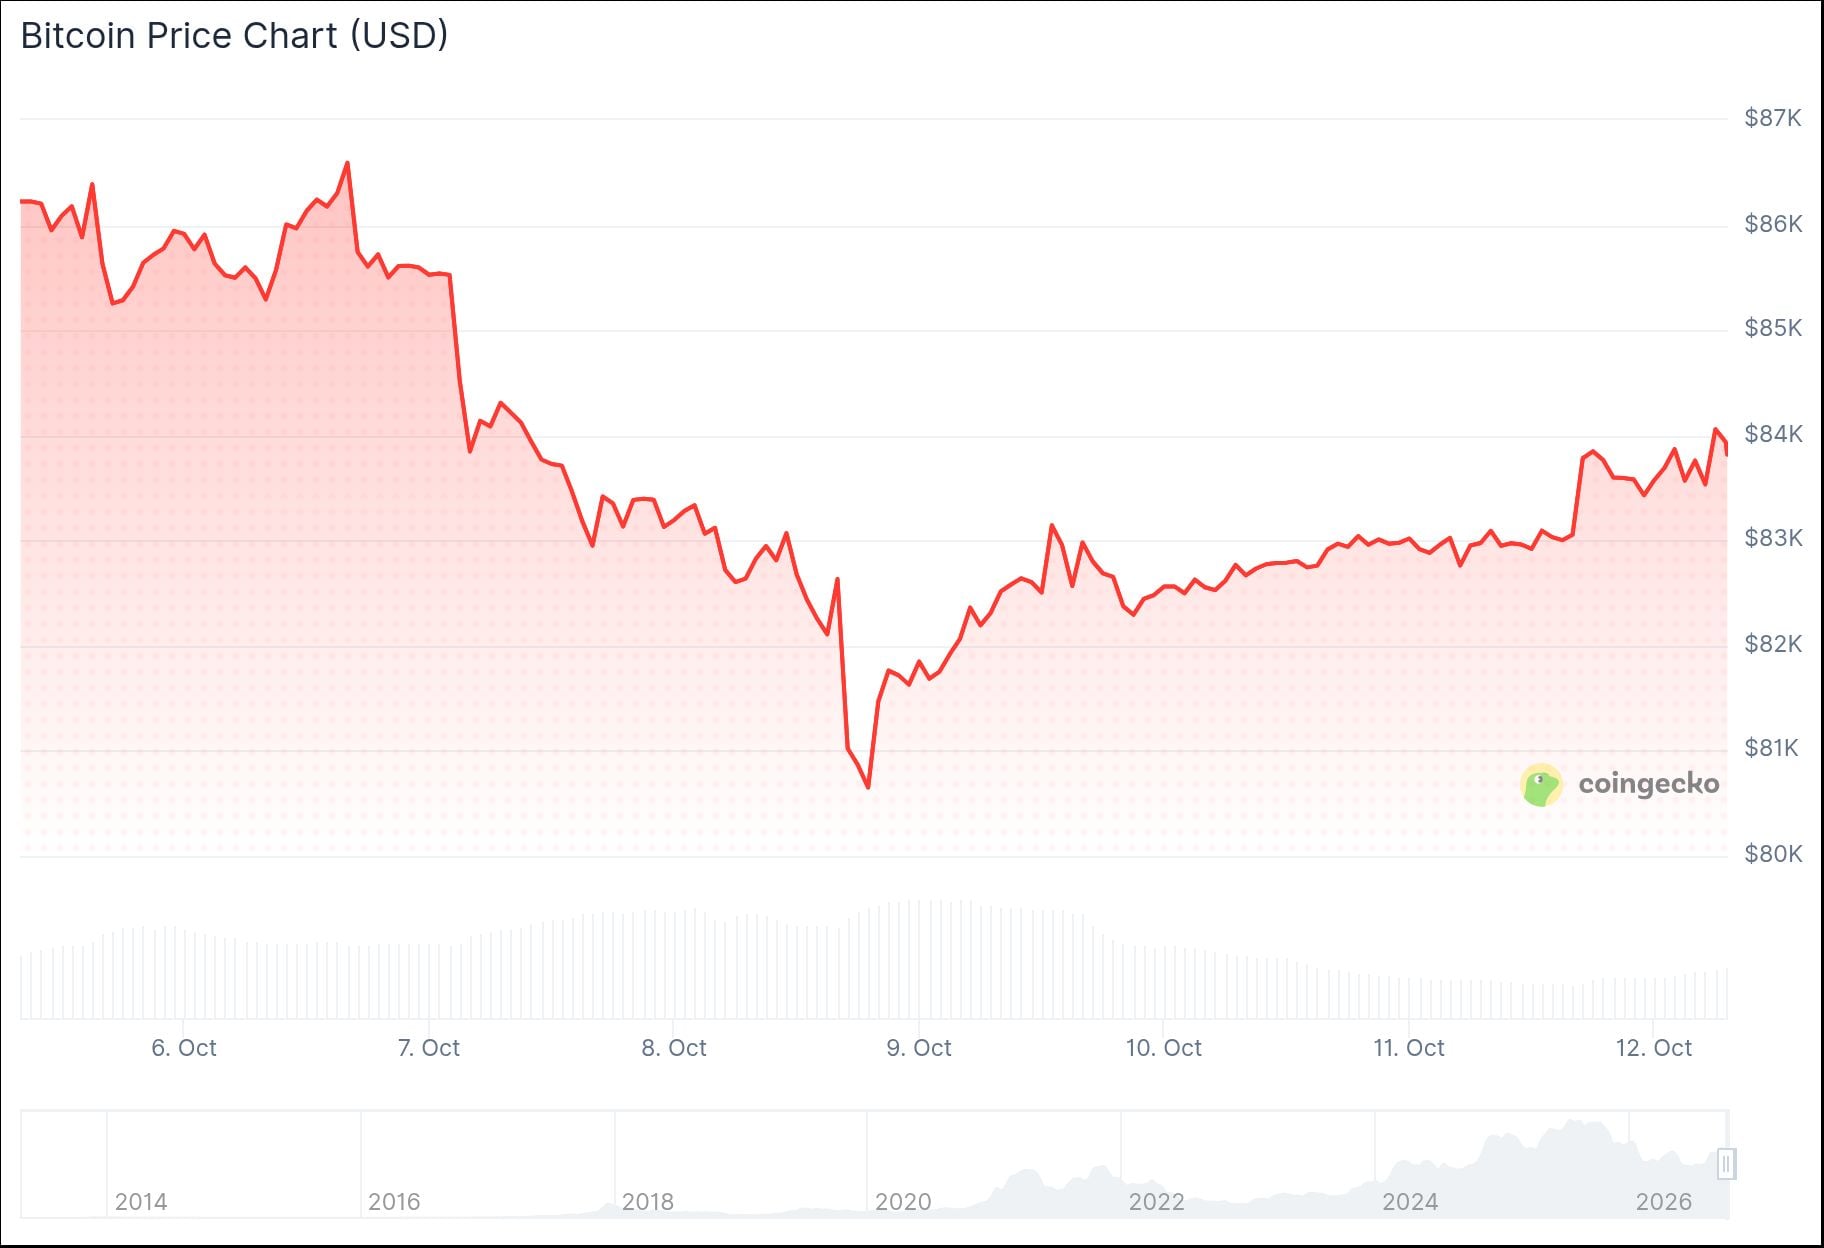
BTC remains inside a defined range between $80,314 and $87,397. The move leaves it up slightly on the day.
Chart Analysis
The rally from the August lows is still intact. A rising trendline continues to act as support. Price briefly dipped below it, but buyers pushed BTC back above it quickly.
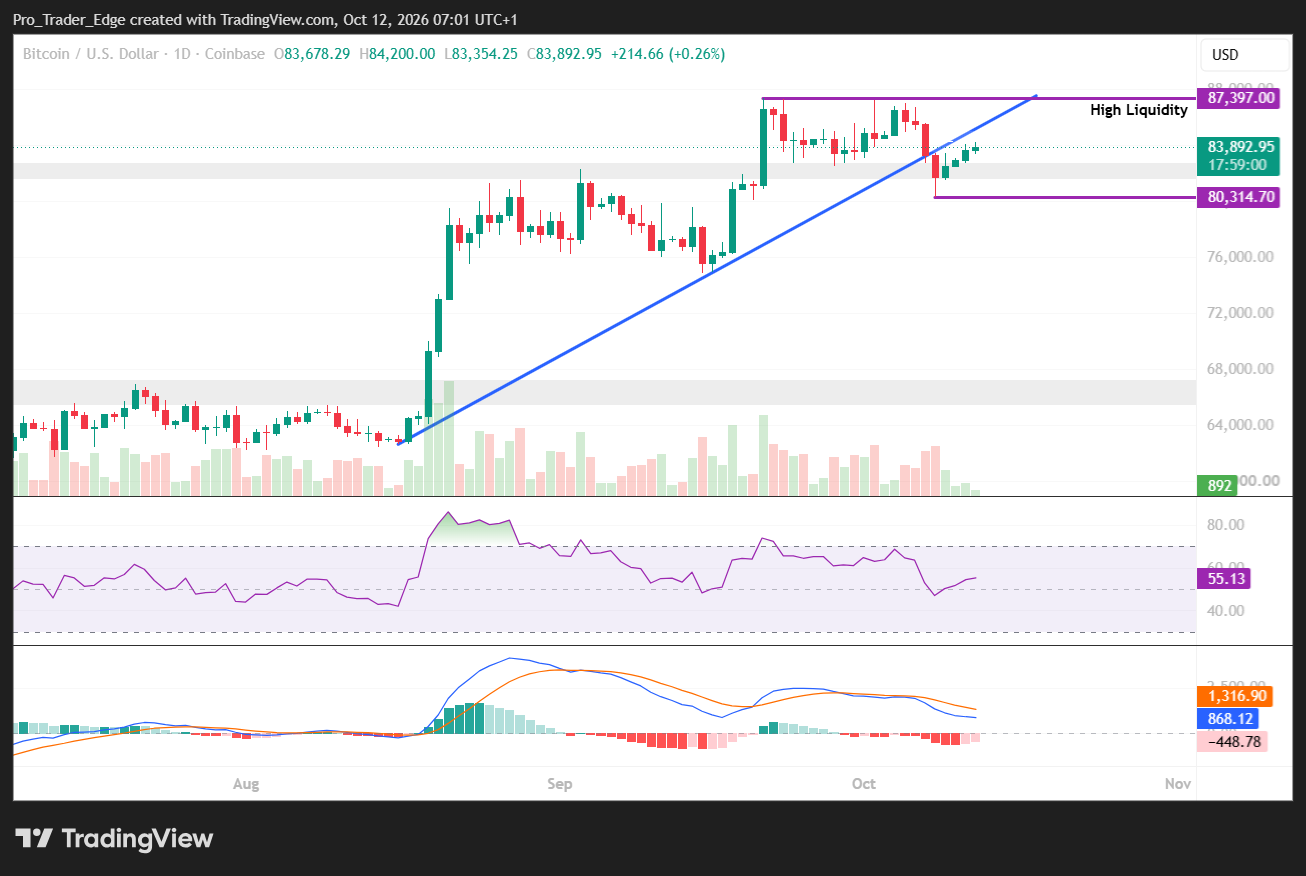
The lower end of the range near $80,314 is the key support level. The upper end at $87,397 is the main resistance and a high-liquidity zone. A move above it would make a new breakout attempt more credible.
Momentum signals are mixed. The RSI is 55.13, which is slightly bullish. The MACD line is below its signal line and the histogram is negative, so the trend has not fully picked up speed.
Traders should watch the $83,000 to $83,500 area next. It is the nearest support and sits close to the recovered trendline. A loss of $80,314 would point toward the high-$70,000s.
Analyst views on the longer-term picture are leaning positive. Coin Bureau said Bitcoin’s bear market could already be over, citing a Glassnode chart. It said BTC’s MVRV momentum has turned positive.

🔥BULLISH: Bitcoin’s bear market COULD already be OVER, per this Glassnode chart.
BTC’s MVRV momentum has turned POSITIVE, flashing the same recovery signal seen in 2019 and 2023.
The MVRV ratio now stands at 1.54, above its annual average of 1.44, suggesting bullish momentum… pic.twitter.com/cVqFRKboS3
— Coin Bureau (@coinbureau) October 11, 2026
That is the same recovery signal seen in 2019 and 2023, according to the post. The MVRV ratio stands at 1.54, above its annual average of 1.44.
ETF flows are driving short-term sentiment. U.S. spot Bitcoin ETFs took in $118.8 million on Oct. 6. They then saw $484.9 million in net outflows on Oct. 7.
Before that, the funds recorded $89.8 million of outflows on Oct. 5. Inflows of $189.9 million and $102.7 million came on Oct. 2 and Oct. 1.
BlackRock’s IBIT leads the group in cumulative flows. Total net inflows across all U.S. spot Bitcoin ETFs stand near $57.4 billion.
Macro Backdrop
Inflation data is the main focus this week. U.S. CPI is due Wednesday, with PPI and retail sales due Thursday.
Reuters reported that oil prices eased after President Donald Trump claimed an energy ceasefire between Russia and Ukraine. That has helped cool some inflation pressure at the start of the week.
Traders remain cautious because inflation expectations are elevated and Treasury yields are high. A higher-than-expected CPI reading could strengthen the dollar and push yields up.
Ash Crypto added to the bullish case on Oct. 12. The analyst said Bitcoin has confirmed its fourth straight weekly close above the 50-week moving average.
BREAKING: Bitcoin just confirmed its 4th consecutive weekly close above the 50-week Moving Average.
Historically, this means the bottom is in and the new bull market has started. pic.twitter.com/UFHeRCjw2z
— Ash Crypto (@AshCrypto) October 12, 2026
Ash Crypto noted that this has historically meant the bottom is in and a new bull market has started.
Bitcoin was trading near $83,893 at the latest check, inside its $80,314 to $87,397 range.



Be the first to comment