

Bitcoin (BTC) price is trading near $63,000 after suffering a sharp correction from its recent highs around $82,000. The decline has pushed the crypto back to one of its most important long-term support levels—the 200-week moving average (200WMA). Historically, this level has acted as a major floor during bear markets and macro corrections. However, the 2022 FTX-driven collapse showed that Bitcoin can temporarily break below this support when market conditions deteriorate significantly.
As BTC retests this critical zone, traders are closely watching whether history repeats itself with another accumulation opportunity or whether a deeper correction toward $50,000 is on the horizon.
Bitcoin Revisits the 200-Week Moving Average
The Bitcoin price has been experiencing strong upward pressure for the past few days. With this, the price has dropped to one of the crucial support levels, the 200-day weekly MA, after breaking the crucial base at $65,000. These levels have often served as a reliable base during Bitcoin’s most severe market downturns. And hence, breaking these levels is believed to cause more harm to the rally.
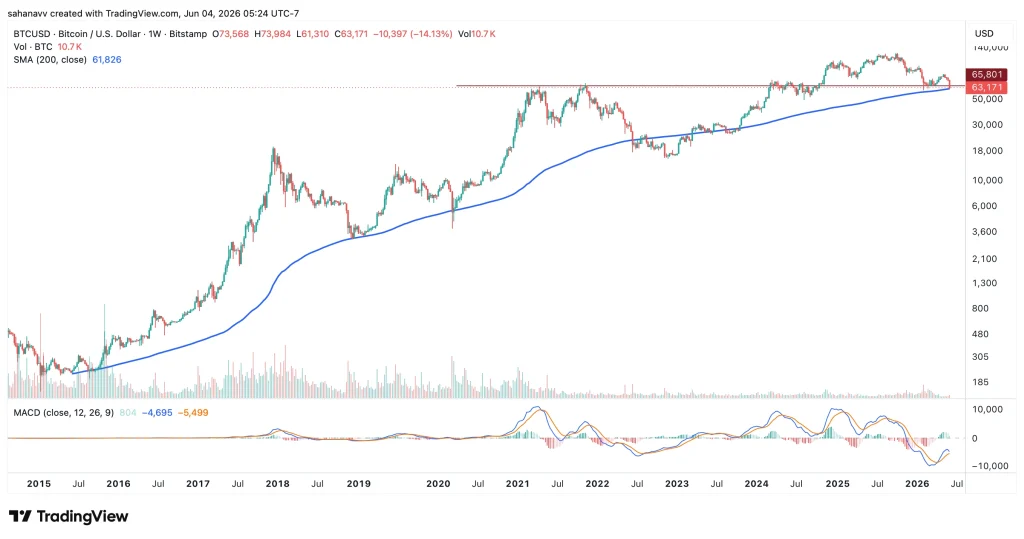
As seen in the above chart, the 200-day weekly MA has been one of the strongest supports since the beginning. The price has always defended these levels and initiated a strong upswing. However, the MACD is flashing a massive bearish signal as it is about to undergo a bearish crossover, being within the negative range. This is expected to drag the price lower if the bulls fail to defend this support at $61,289. From the price structure, the price range between $60,000 and $62,000 is extremely crucial, and holding above the range may keep the bullish prospects alive.


What if Bitcoin Fails to Defend These Levels?
The return of the BTC price to the crucial 200-day weekly MA has raised massive concerns about the upcoming price action. However, Bitcoin’s realised price is currently sitting near $53,800, while the BTC continues to trade above $63,000 despite the recent sell-off. And hence, these levels can be treated as the last point of defense for the BTC price, which may trigger a rebound.
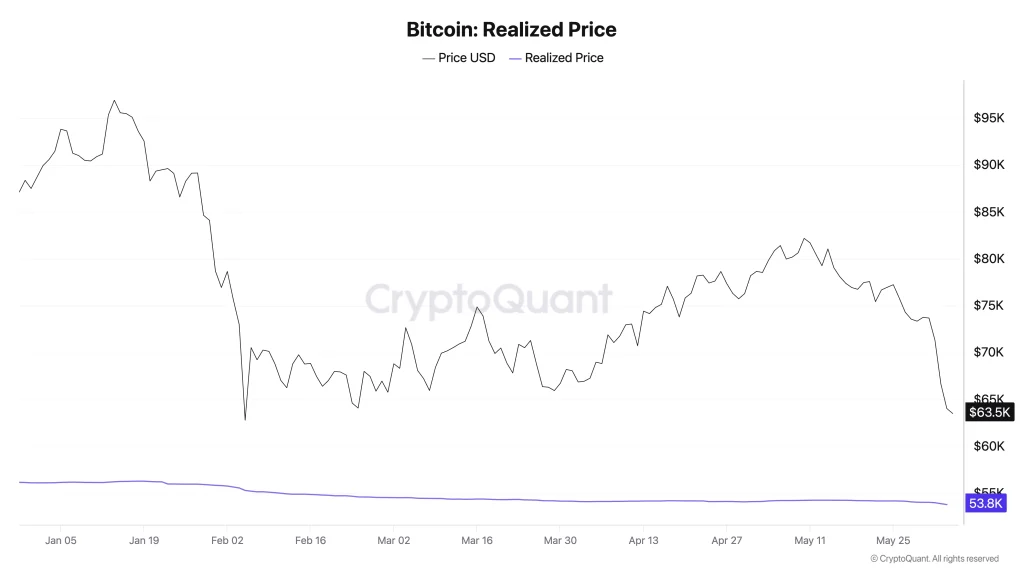
The Realized Price represents the average acquisition cost of all circulating Bitcoin and is widely viewed as one of the most important on-chain support levels. Historically, prolonged bear markets have often pushed Bitcoin below this metric, triggering widespread capitulation among investors. However, the latest decline has only narrowed the gap between the spot price and the network’s aggregate cost basis.
This suggests that most holders remain in profit despite the ongoing correction. As a result, the current decline appears more consistent with a major market reset than a full-scale bear market breakdown
Why Bearish Clouds are Hovering on the BTC Price Rally
Data from CryptoQuant shows Bitcoin’s Market Value to Realized Value (MVRV) ratio has fallen sharply to around 1.19, marking one of its lowest readings in recent months. The MVRV ratio compares Bitcoin’s market capitalization to its realized capitalization and is widely used to assess whether the asset is overvalued or undervalued relative to investors’ aggregate cost basis. Historically, elevated MVRV readings have coincided with periods of market euphoria and cycle tops, while readings near 1 have often emerged during accumulation phases and major market bottoms.
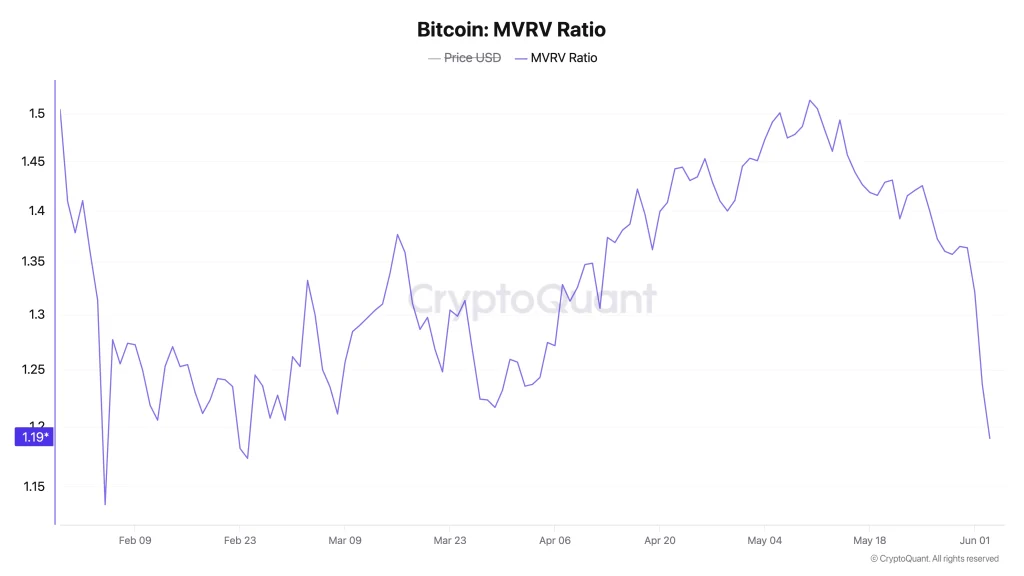
As seen in the above chart, the MVRV ratio has dropped significantly in the past few days. This indicates many holders are at a loss or barely profitable, as the fear is dominating the rally. The drop also suggests that the weak hands have already sold, bringing the token under extreme pressure. However, this also points towards long-term buying opportunities as BTC price has formed the bottom when MVRV fell near or below 1.
What’s Next: Accumulation Opportunity or Start of a Deeper Correction?
Bitcoin price is approaching a decisive moment as it tests the historically significant 200-week moving average. While the recent correction has intensified bearish sentiment, on-chain metrics such as Realized Price and MVRV suggest the market is moving closer to long-term accumulation territory rather than extreme overvaluation.
As long as BTC holds above the $60,000–$62,000 support zone, the possibility of a strong recovery remains intact. However, a sustained breakdown below this level could accelerate selling pressure and increase the likelihood of a deeper correction toward the $50,000–$55,000 range.
Was this writing helpful?
Story Ends Here
Trust with CoinPedia:
CoinPedia has been delivering accurate and timely cryptocurrency and blockchain updates since 2017. All content is created by our expert panel of analysts and journalists, following strict Editorial Guidelines based on E-E-A-T (Experience, Expertise, Authoritativeness, Trustworthiness). Every article is fact-checked against reputable sources to ensure accuracy, transparency, and reliability. Our review policy guarantees unbiased evaluations when recommending exchanges, platforms, or tools. We strive to provide timely updates about everything crypto & blockchain, right from startups to industry majors.
Investment Disclaimer:
All opinions and insights shared represent the author’s own views on current market conditions. Please do your own research before making investment decisions. Neither the writer nor the publication assumes responsibility for your financial choices.
Sponsored and Advertisements:
Sponsored content and affiliate links may appear on our site. Advertisements are marked clearly, and our editorial content remains entirely independent from our ad partners.
Read the Next News


Be the first to comment