


Bitcoin stabilization is in progress. The asset recently lost support in the $72,000-$74,000 range, which led to a quick sell-off that drove Bitcoin down to the low $60,000s before buyers entered the playing field. The strong reaction from the $61,000-$63,000 zone is the chart’s most significant moment.
Bitcoin saw a relief rally back toward $66,000 as soon as buyers were drawn in by the panic-driven decline (in the mid-term). This implies that, rather than the start of a full-scale bear market, market players continue to see the region as a major accumulation zone. That interpretation is supported by volume behavior, which has calmed down by now.
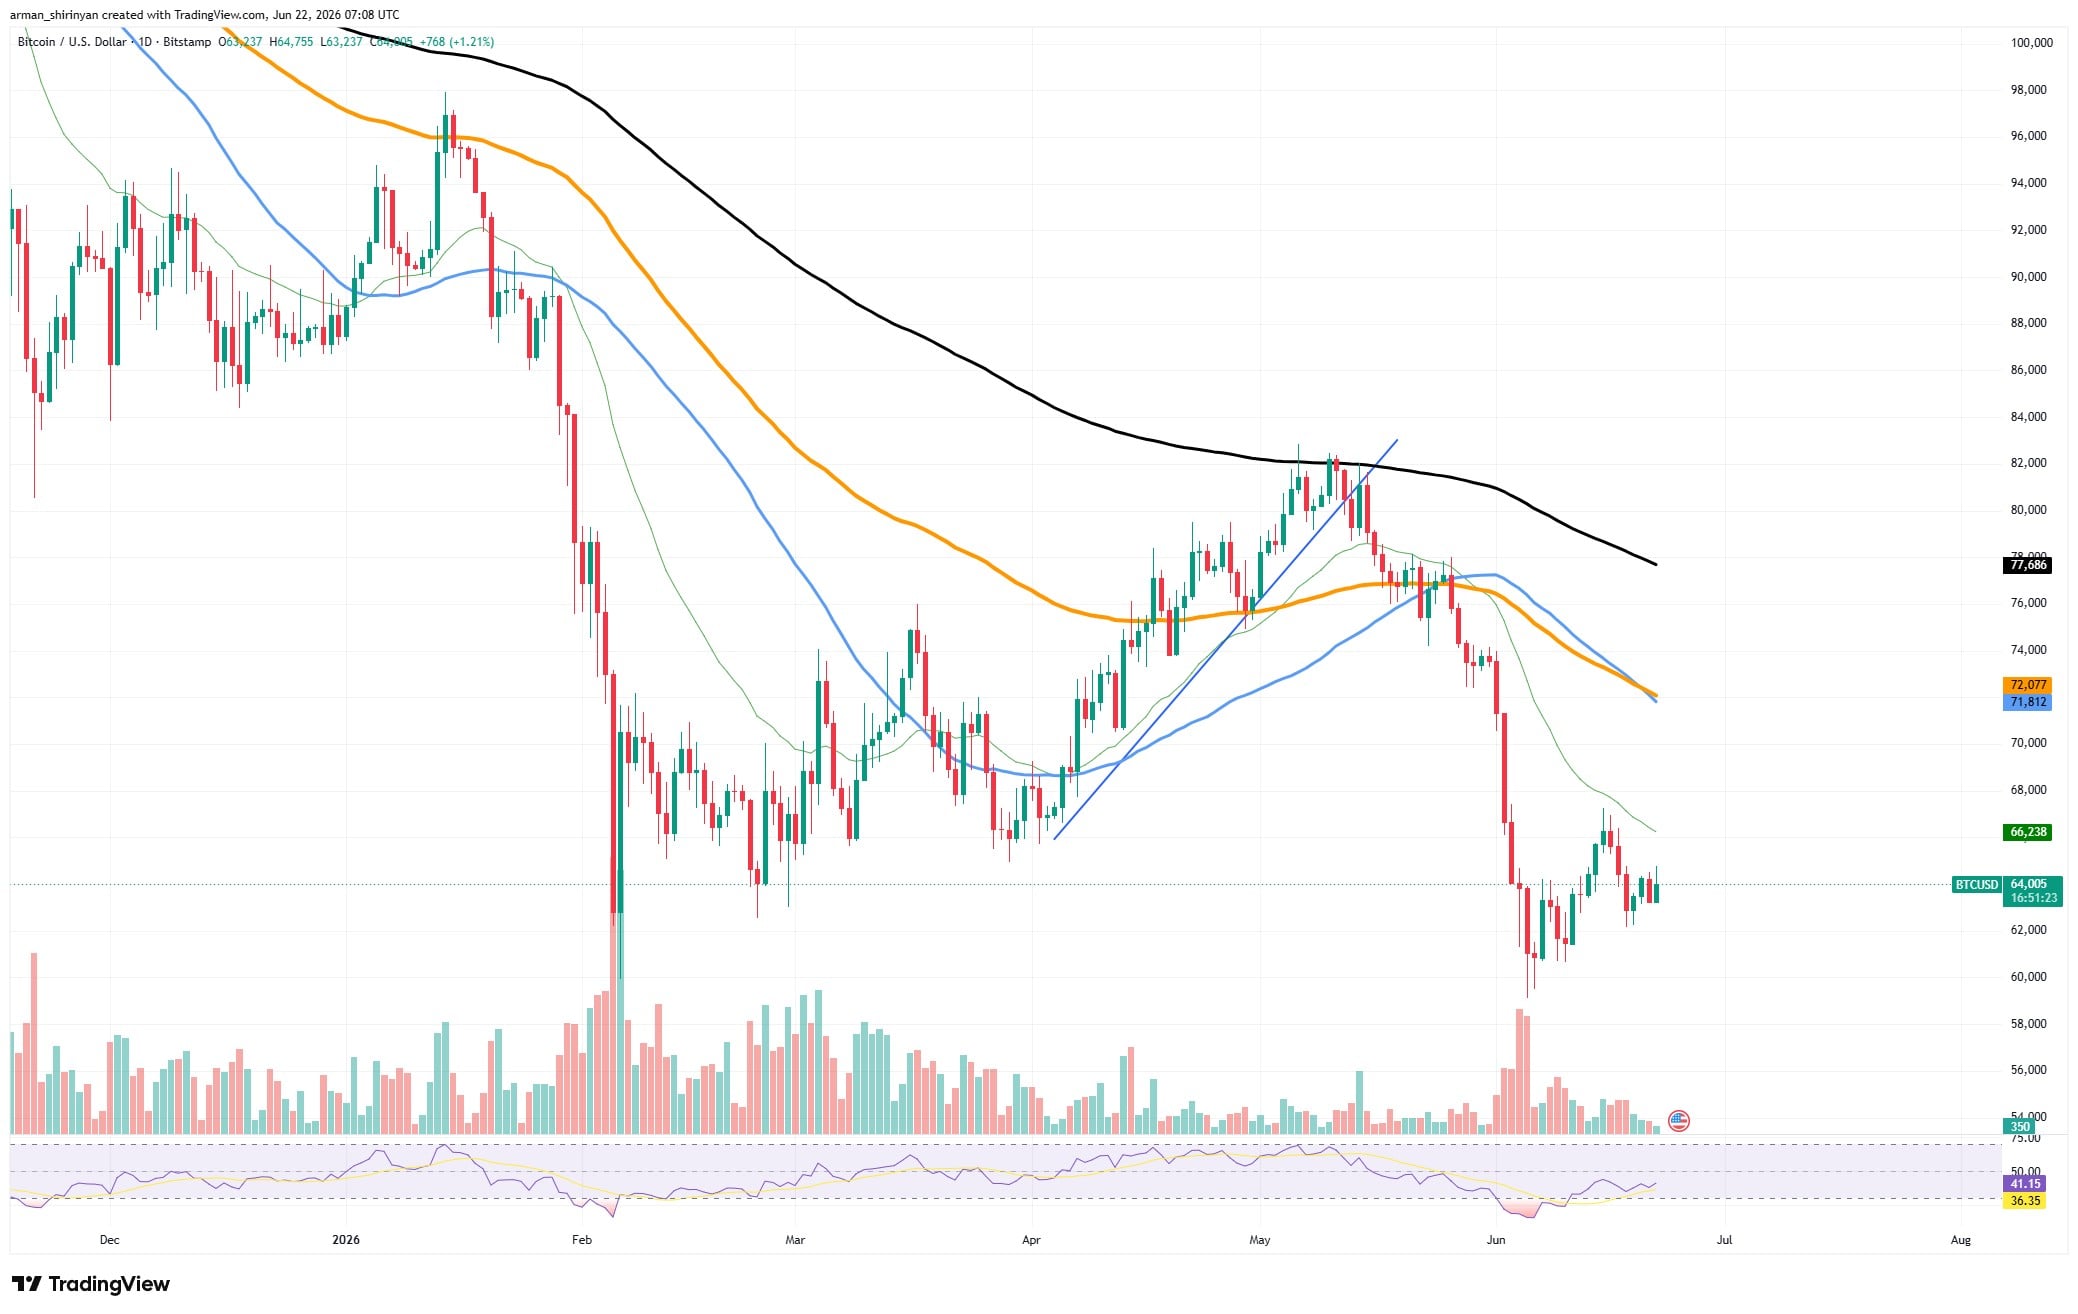
The breakdown itself caused the biggest volume spike of the year, which was indicative of significant forced selling and liquidation activity. In the past, these occurrences frequently indicate market exhaustion points where weaker players withdraw from the market to make room for stronger buyers to absorb supply. Nonetheless, the technical framework is still unstable.

Bitcoin is still trading below its 50-day and 100-day moving averages, and the previous $72,000 support level is now a significant barrier. More significantly, the asset recently lost an upward trendline that had bolstered the April-May recovery rally. Sellers continue to have the advantage on longer timeframes until that level is regained. The momentum indicators are starting to improve.
You Might Also Like

The RSI is gradually moving back toward neutral territory after recovering from extremely oversold conditions. This indicates that bearish momentum is waning, in contrast to the panic observed during the initial collapse, even though it does not prove a reversal.
For the time being, Bitcoin does not seem to be continuing its downward trend; instead, it seems to be in a recovery phase. Bulls still need to recover important resistance levels before the overall outlook turns back in their favor, even though the steep sell-off has been absorbed surprisingly well. The fight between $72,000 resistance and $64,000 support will probably decide Bitcoin’s course going into the next significant move.
Shiba Inu’s recovery effort
Although Shiba Inu is making an effort to bounce back from its recent collapse, the chart indicates that bulls still have a tough fight ahead of them. SHIB was able to create a temporary bottom and generate a small relief rally after collapsing earlier this month toward the $0.0000044 region.
The issue is that momentum has already started to wane. Although the asset recently recovered from oversold conditions, selling pressure has always been present close to the short-term moving averages. SHIB is still below its 50-day, 100-day and 200-day moving averages, all of which are pointing lower and supporting the general downward trend. A small ascending support structure also seems to be forming as a result of the recent rebound.
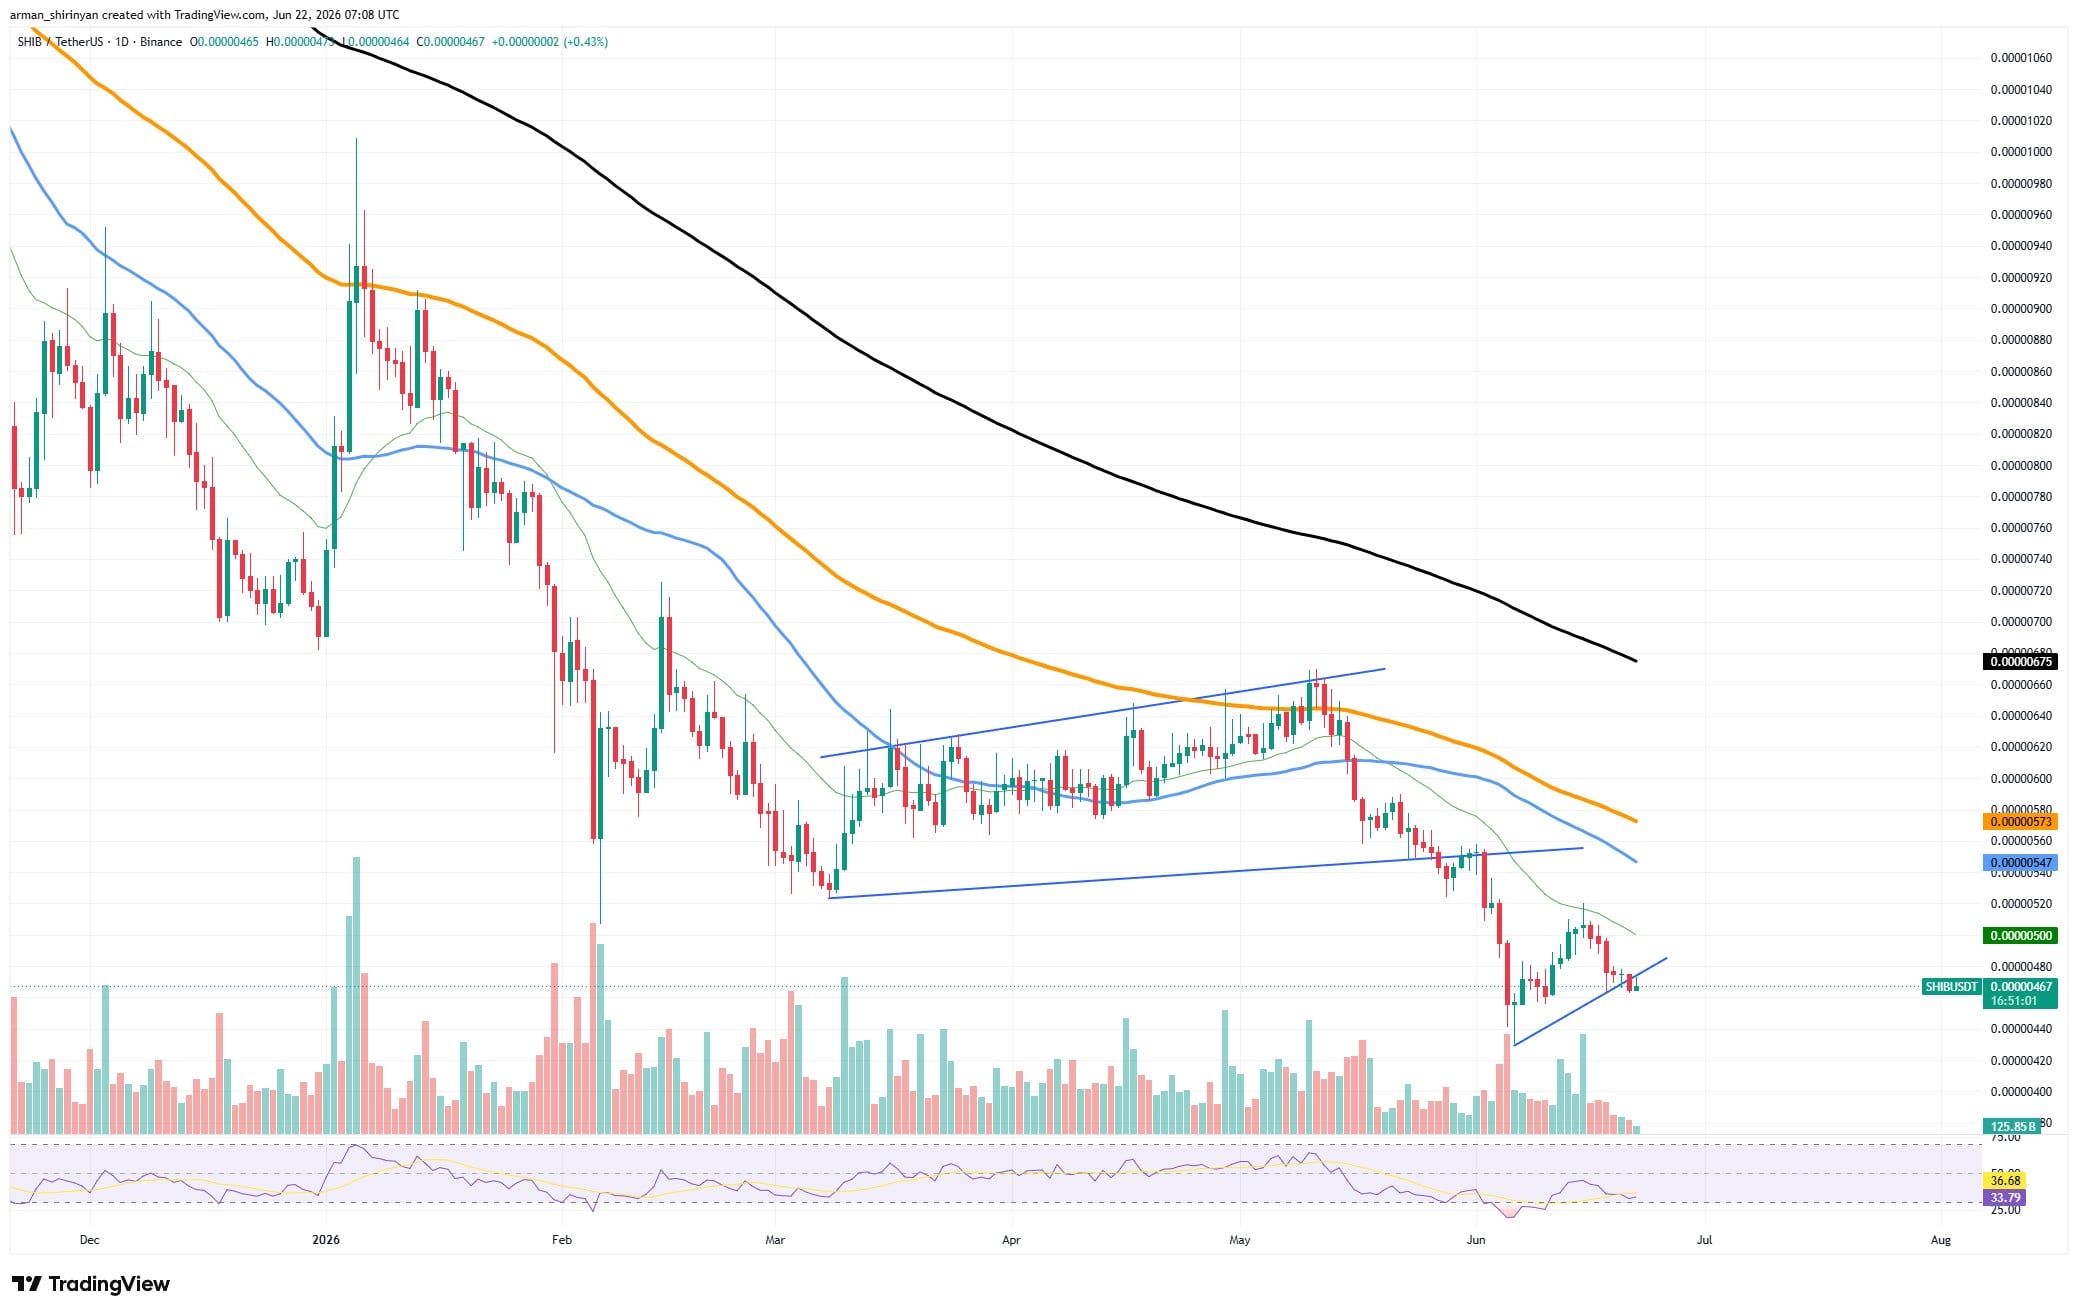
The larger breakdown from the multi-month wedge pattern that dominated price action throughout the spring outweighs that, even though it is beneficial in the short term. Bulls cannot assert significant control until SHIB reclaims the $0.0000050-$0.0000055 region. Since the first panic sell-off, volume has decreased, indicating that sellers may be losing steam. Additionally, there hasn’t been enough buying activity to cause a significant reversal.
The market is stabilizing rather than rising, as indicated by the RSI, which has recovered from oversold territory but is still below neutral levels. SHIB currently seems to be caught between resistance above and support close to recent lows. While a loss of current support would probably push the asset back toward its June bottom, a break above nearby moving averages could lead to a recovery of at least 10%.
Ethereum’s resilience
Despite the recent market correction, Ethereum has demonstrated far greater resilience than many alternative assets as it’s drawdown from the local top appears to be less substantial. ETH found support around $1,670 after plummeting from the $2,300-$2,400 range, and it has since started to build a recovery base. After a significant breakdown from its descending structure, Ethereum is seen on the daily chart trying to recover lost ground.
Additionally, volume increased during the sell-off and subsequent recovery, suggesting active market participation as opposed to a gradual decline. Ethereum is still up against a lot of opposition, though. The first significant barrier is located at $1,800, close to the 50-day moving average. The 100-day and 200-day averages then form a much more robust resistance cluster between $2,000 and $2,350.
You Might Also Like

Instead of a sudden reversal of the trend, the current chart configuration favors ongoing stabilization. Buyers have a chance to gain momentum toward the $1,800 area as long as ETH stays above the recent low. Regaining that level would significantly enhance the technical outlook and raise the likelihood of a more significant recovery rally.
Ethereum is currently exhibiting signs of strength, but a successful break above the key resistance zones that continue to limit price action will be necessary to confirm a new uptrend.
XRP’s uptrend is fragile
XRP’s recovery rally is actually weaker than it may seem at first. The asset fell toward the $1.13 region after failing to break the crucial $1.30 resistance zone, but buyers eventually stepped in and stopped a further decline. XRP has been working to develop a recovery base ever since.
Demand is still present, as seen by the recent rebound toward $1.20, but the rally soon ran into resistance and was unable to reach a higher high. As not enough power was generate for a bounce, XRP went sideways and stuck in an unsuccessfull recovery phase. Technically speaking, XRP is still trading below its 50-day, 100-day and 200-day moving averages.
You Might Also Like

The first significant resistance level is now the 50-day moving average around $1.20; bulls still need to reclaim the larger resistance zone between $1.25 and $1.35 in order to significantly alter market sentiment.
The behavior around recent lows is an encouraging development. The asset has held above the June low despite multiple attempts by sellers to drive XRP lower. This implies that buyers are becoming more active at lower prices and that selling pressure is progressively waning. Momentum indicators are consistent with that view.
This frequently occurs when markets shift from capitulation to accumulation, though additional price improvement is necessary for confirmation. The $1.20 key level is still in place.
The former zone at $1.30 would probably be accessible if a breakout above that resistance were successful. That action might signal the start of a more significant reversal and constitute a significant recovery from current prices.
Be the first to comment