



After failing to hold above a number of significant moving averages, Bitcoin is displaying signs of weakness. The most recent daily candles indicate that bearish momentum is starting to pick up steam. Just below the 200-day moving average, which still serves as a significant technical barrier, Bitcoin seems to have lost momentum following a robust recovery from the March lows.
A pivotal moment in the recent rally occurred with the rejection in the $81,000-$82,000 range. Although buyers were unable to produce enough volume to maintain the move, Bitcoin momentarily broke above its rising trendline and moved toward long-term resistance. The asset has since rolled over and fallen below the short-term support structure.
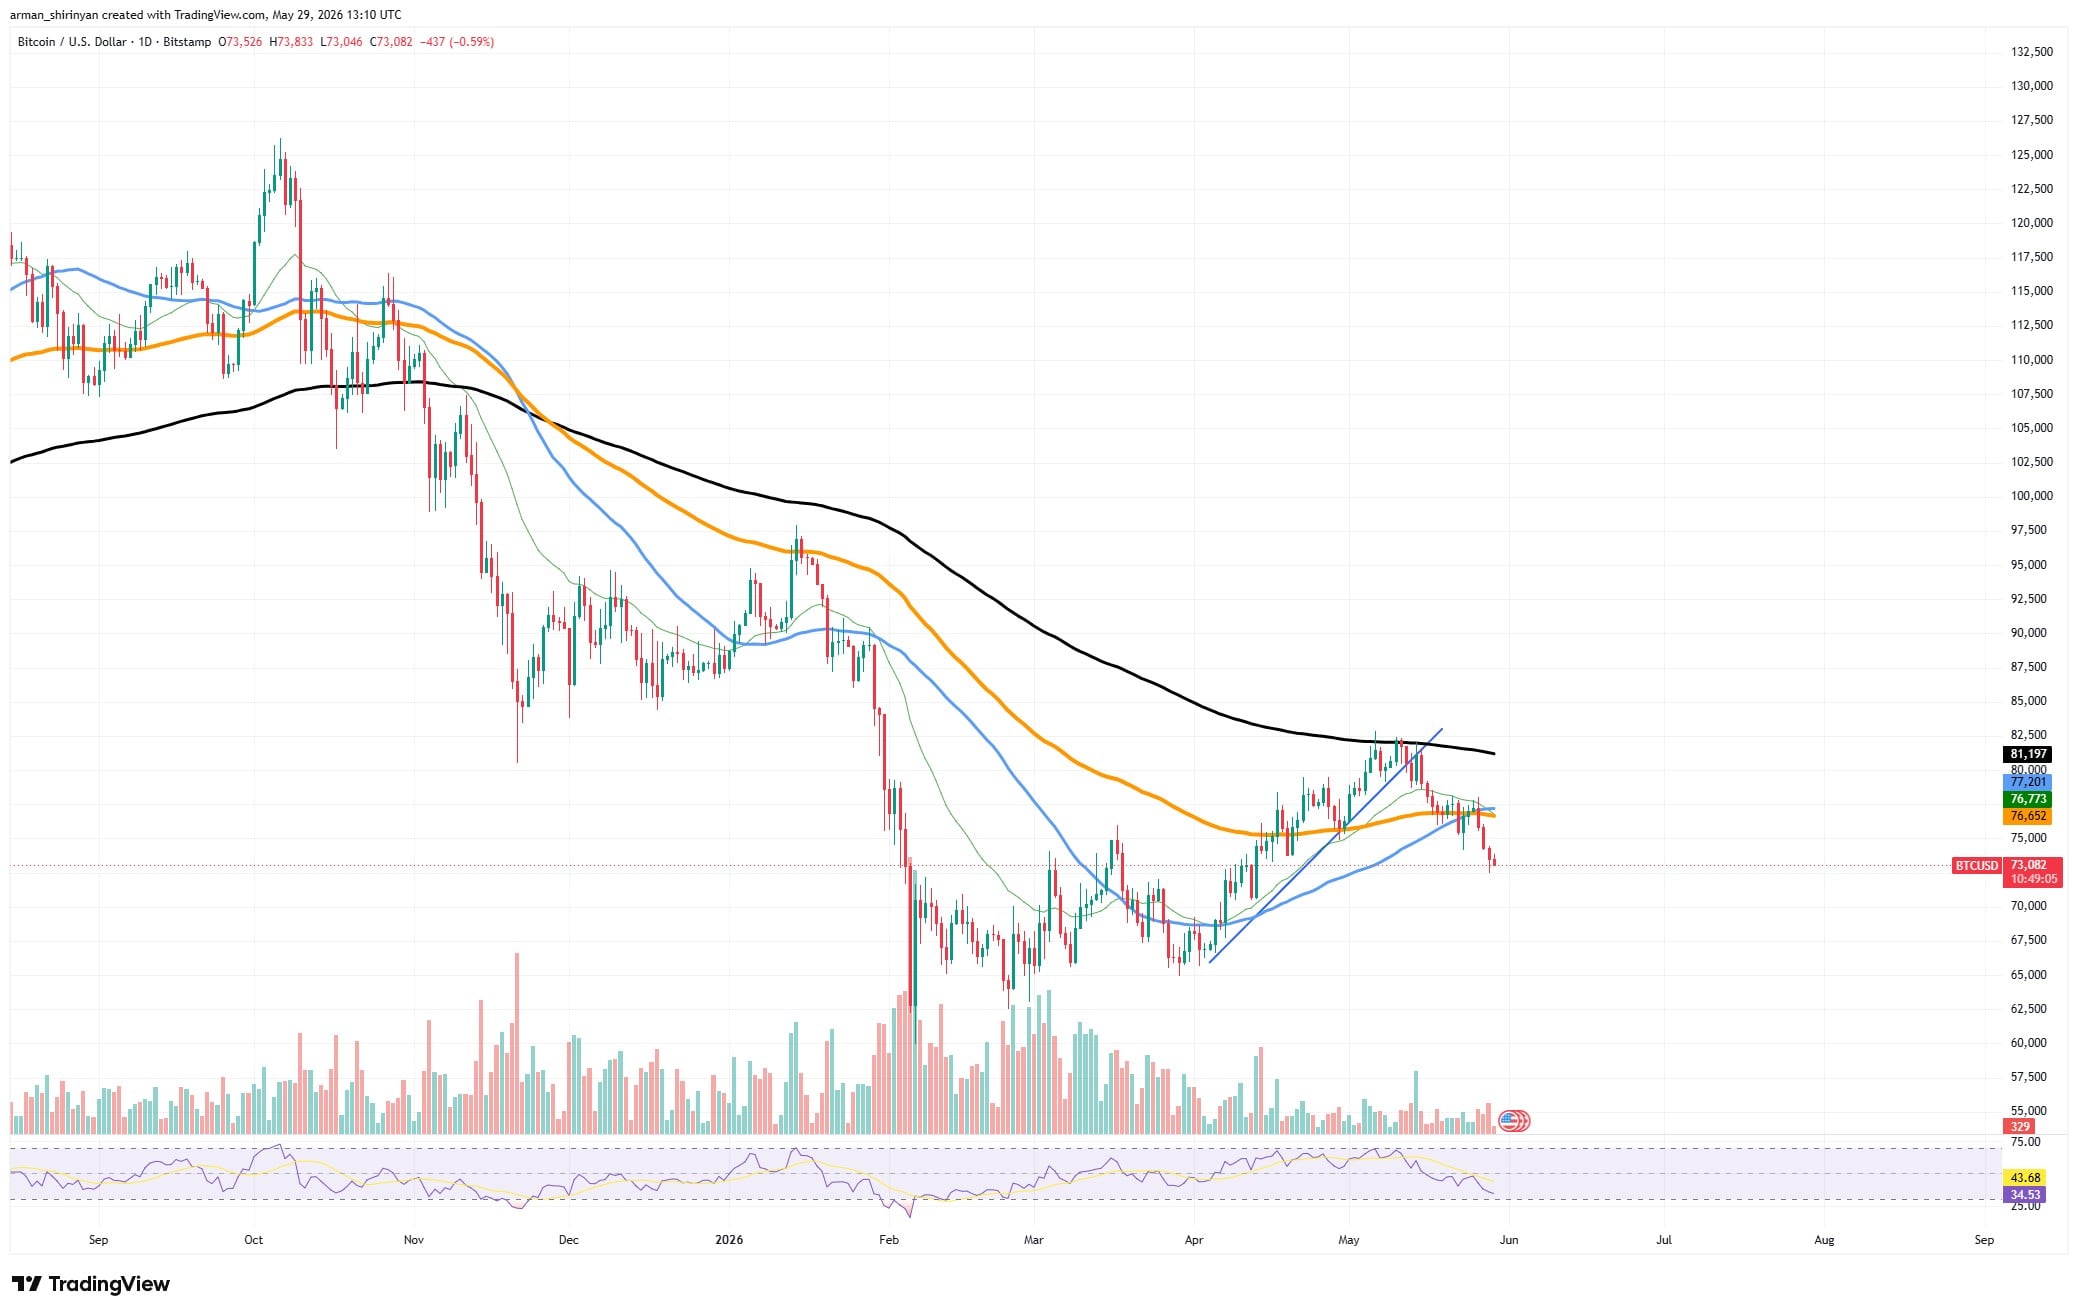
Bitcoin is currently trading below the 20-, 50-, and 100-day moving averages on the daily chart. After several weeks of rising momentum, the 50-day moving average is starting to flatten, which is even more worrisome for bulls.

This usually precedes a deeper correction phase and indicates a decline in trend strength. Additionally, momentum indicators show caution. Reduced buying pressure is reflected in the Relative Strength Index’s decline toward the lower half of its range. Sellers may be able to maintain control in the near future because there is still space before oversold conditions materialize.
You Might Also Like

The $70,000-$72,000 range is the next important area to keep an eye on. This area was crucial for consolidation in April, and if the current selling pressure persists, it may become the first important support. Bitcoin would probably be vulnerable to a move toward the mid-$60,000s if it broke below that level. Bulls have a simple but challenging road to recovery.
After regaining the cluster of moving averages between $76,000 and $77,000, Bitcoin needs to challenge the 200-day moving average at $80,000. The larger trend is still susceptible in the absence of that development. The most recent breakdown indicates that traders are getting more defensive, even though the long-term market structure has improved since the February lows.
ZCash cools off
After one of the most spectacular rallies in the cryptocurrency market, Zcash has entered a cooling phase, but the overall trend is still very bullish. ZEC is still trading comfortably above all major moving averages, despite a steep decline from recent highs, maintaining a structure that many altcoins would find difficult to match.
Zcash saw one of the biggest momentum moves in the market this year as a result of the recent rally, which took it from below $250 to almost $700 in a matter of weeks. The current correction seems to be a natural response to overheated conditions rather than a reversal of trend, and such aggressive advances seldom follow a straight line.
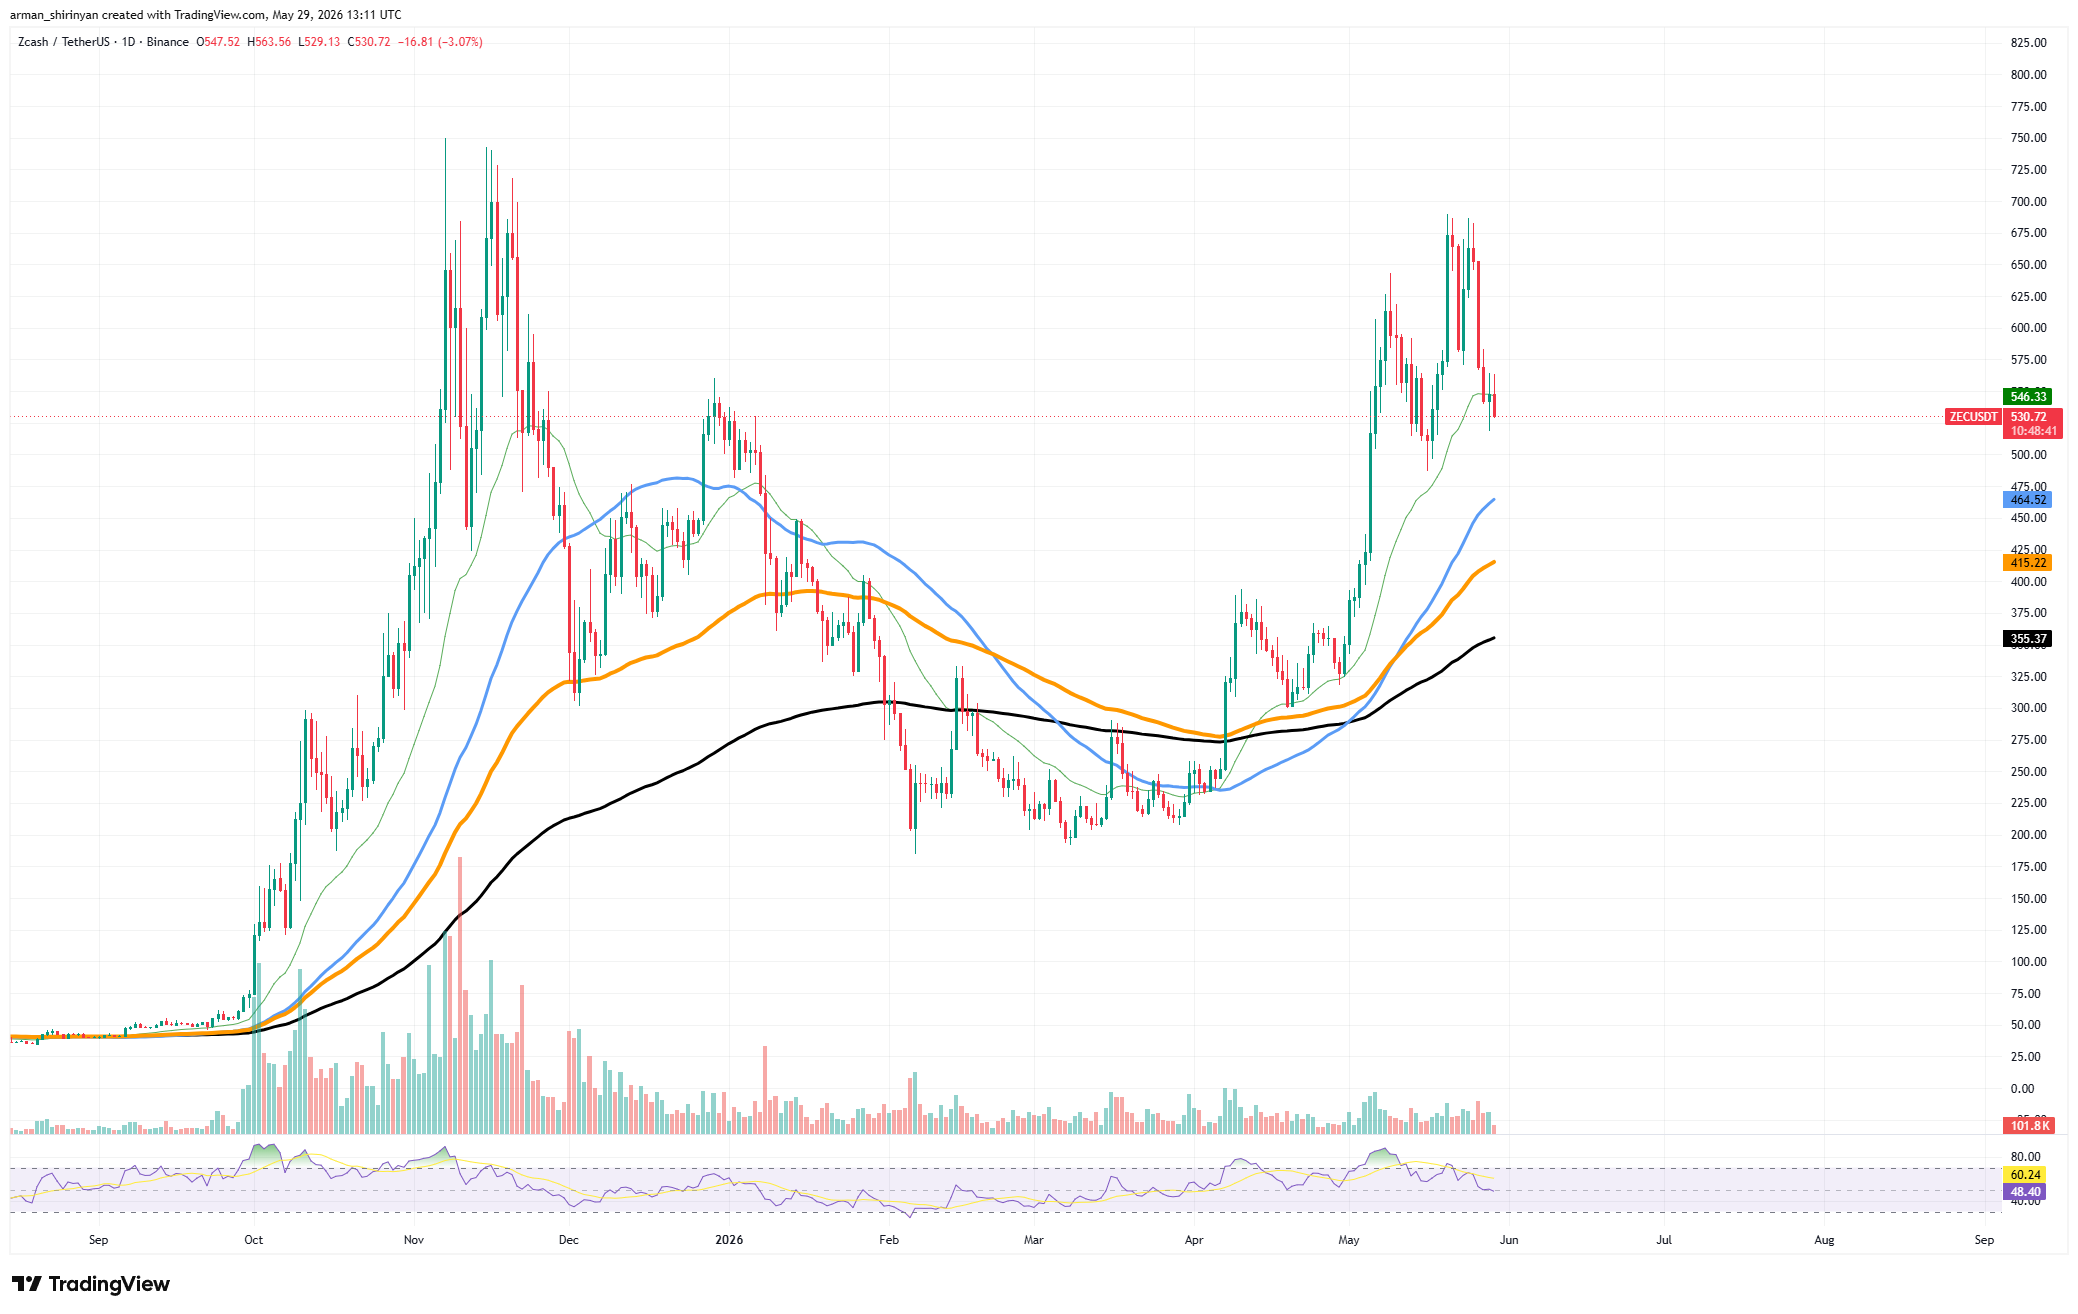
Technically, ZEC is still in a very good place. The 20-day moving average is presently offering dynamic support close to the $550 area and is still trending upward. The asset’s vertical rise was so prolonged that the 50-day and 100-day moving averages are much lower.
The consolidation thesis is supported by volume patterns. During the breakout phase, trading activity increased, and during the pullback, it gradually decreased. Profit-taking is more frequently linked to this behavior than widespread distribution.
You Might Also Like
Additionally, the Relative Strength Index has moved away from overbought territory, eliminating some of the excessive speculation that had built up during the rally. In the end, this reset might produce a stronger basis for the subsequent directional shift.
The $500-$550 range continues to be the critical support area. The larger uptrend continues as long as buyers protect this area. The door would remain open for another attempt to challenge the recent highs around $700 if it were held above.
A strong move above $600 on the upside might entice momentum traders to reenter the market. After that, focus would probably turn to a retest of the prior peak and the potential for new cycle highs.
Deeper signs of Ethereum’s retrace
After losing a crucial support cluster that had been keeping the market stable throughout April and May, Ethereum is displaying fresh weakness. As ETH trades below several moving averages and breaks below a descending resistance structure that previously defined its consolidation range, the daily chart now indicates increasing bearish pressure.
Ethereum tried to establish a recovery base above the $2,150-$2,200 range for a few weeks. Bulls pushed against a descending trendline overhead while defending this area on multiple occasions. Nevertheless, the pattern resolved to the downside rather than generating a breakout. The price has now fallen below the 50-day and 20-day moving averages, indicating a decline in short-term momentum.
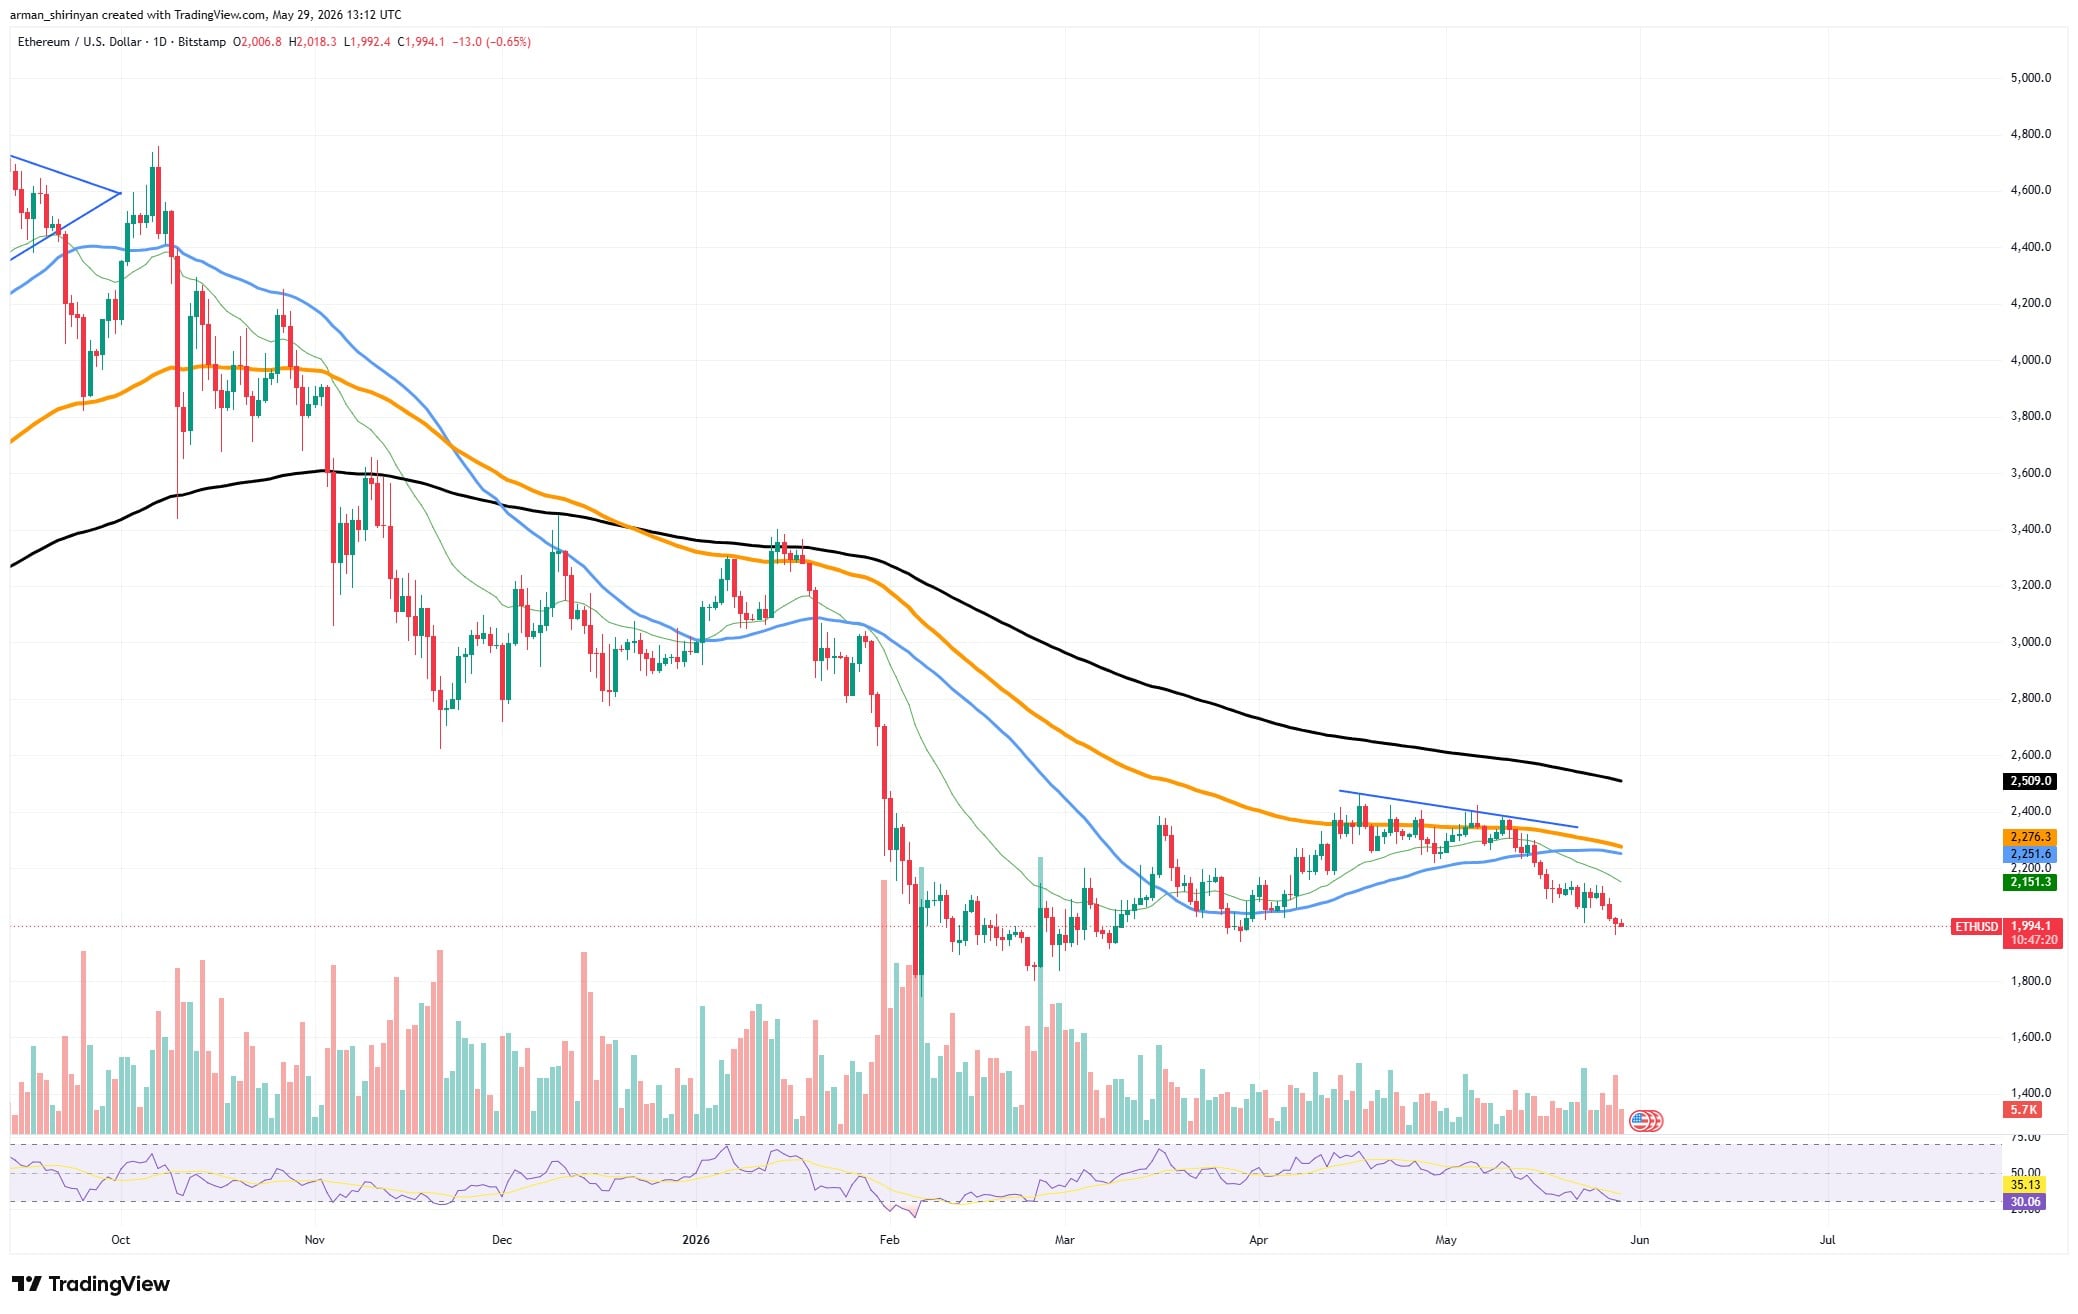
The technical picture has gotten harder. The 200-day moving average is still much higher in the vicinity of $2,500, while the 100-day moving average is situated slightly above the current price and continues to function as dynamic resistance. This implies that, before a significant bullish reversal can occur, Ethereum is subject to several levels of overhead selling pressure.
Caution is also encouraged by momentum indicators. As a result of ongoing selling activity, the Relative Strength Index has declined toward oversold territory. Oversold conditions, by themselves, rarely reverse a trend without significant buying volume, even though this might eventually support a relief bounce.
The psychological $2,000 threshold is the next significant support zone. This region is very important because, after the February selloff, it served as a significant accumulation zone. ETH would be vulnerable to a deeper retracement toward the upper-$1,800 range if there was a clear break below it.
Trends in volume are equally alarming. The recent drop happened without a discernible rise in purchasing activity, indicating that investors are still reluctant to intervene forcefully. Rather, it seems that the market is holding off on making a new directional move until there is a more powerful catalyst.
XRP’s turning point
After compressing inside a descending triangle pattern for months, XRP is getting close to a turning point. The asset is still trading directly above a significant horizontal support zone around $1.30, but the fact that this level has been tested repeatedly raises the possibility that a breakdown is imminent.
You Might Also Like

A more pessimistic chart structure has emerged. XRP has produced a string of lower highs since March, forming a declining resistance line that routinely thwarts bullish attempts. In the meantime, buyers have been able to hold onto support around $1.30. A classic descending triangle, which frequently resolves in the direction of the dominant trend, has been formed by this combination.
The number of times support has already been tested is what makes the current configuration especially vulnerable. The strength of the defensive wall beneath price is weakened by each return to the same level, which tends to absorb buy orders. Therefore, unless new demand enters the market, support gradually deteriorates.
Additionally, XRP is trading below all significant moving averages. The bearish trend is reinforced by the 20-day, 50-day, and 100-day moving averages, which are still above and continue to slope downward. The fact that the 200-day moving average is even higher shows how far away a true trend reversal is from XRP.
You Might Also Like

Additionally, momentum indicators are not supporting the bullish argument. There are no indications of increasing buying pressure, and the Relative Strength Index is still in the lower half of its range. This implies that traders are still more interested in caution than in buying.
The first downside target would probably appear between $1.15 and $1.20 if support eventually breaks. After that, focus would turn to the psychological $1.00 level, which might attract price if overall market sentiment declines.
But XRP hasn’t completely crumbled yet. By reclaiming the declining trendline and pushing back above the $1.45 area, bulls still have a chance to disprove the bearish setup. The lower-high pattern would be broken, and market confidence would rise.


Be the first to comment