


Five trading days have passed since Federal Reserve Chairman Kevin Warsh’s hawkish Jackson Hole keynote. Since then, bitcoin has sat inside a three percent-band between $76,500 and $79,500, despite a further escalation in the Middle East conflict.
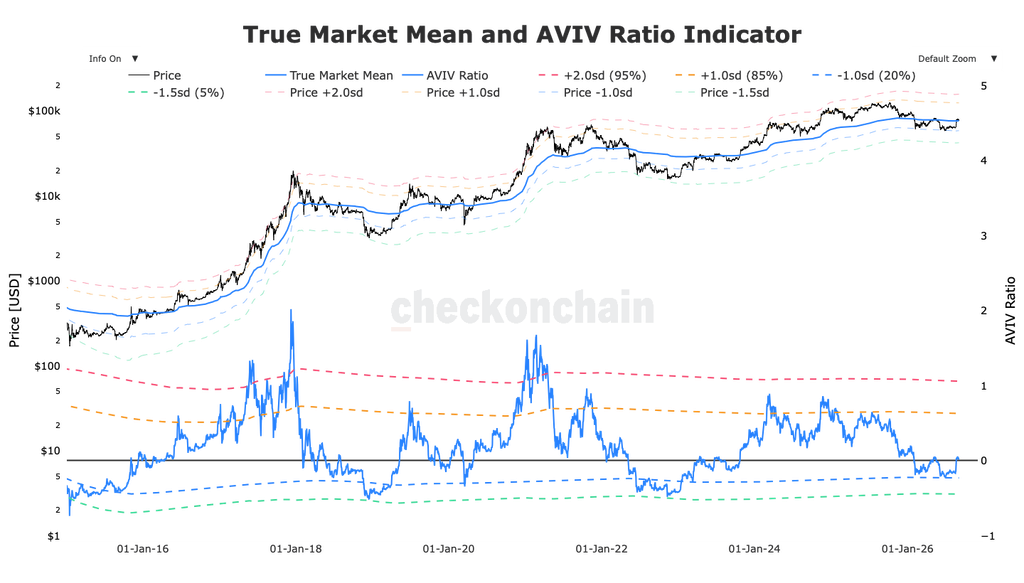
This resilience is consistent with our view that BTC will continue to trade in a lower timeframe range. The range lows carry weight because they sit just above the True Market Mean, the average cost basis of every active investor on the network, which currently stands at $76,350.
A market that gained 21.1 percent in three sessions in mid-August, then repriced following Warsh’s comments on 28 August, has spent the past five sessions trading just above an important supply shelf, where all holders are currently breakeven.
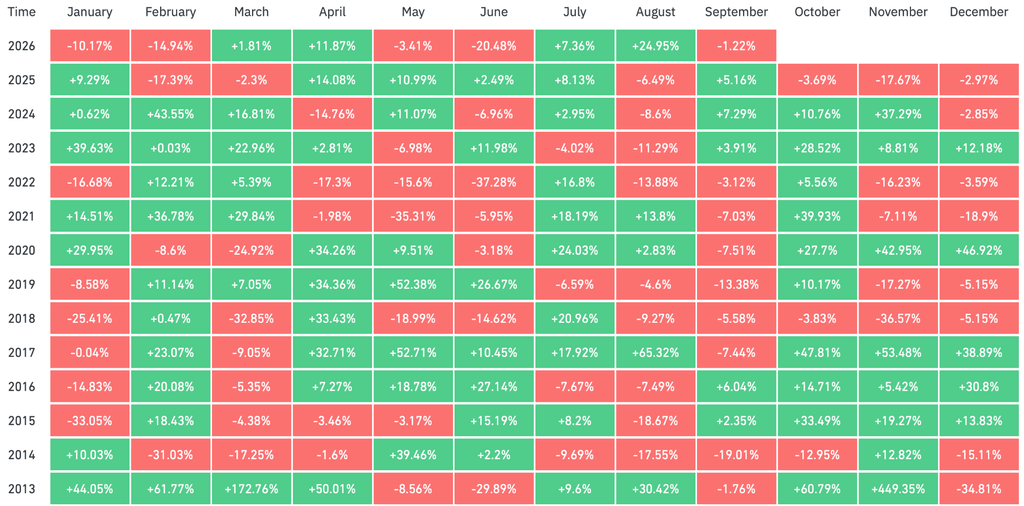
For the month, August closed up 24.9 percent from its $62,922 open, the first positive August since 2021 and the largest monthly gain since November 2024. Volumes and volatility have picked up in tandem with price. The escalation in the US-Iran conflict and the stall at the True Market Mean hold the uptrend in place for the time being.

The -1 standard deviation band has held as support for several months over the course of the bear market. It is also interesting to note that the current +1 standard deviation band sits close to all-time-high (ATH) territory at $124,200.
September has historically been a bearish month for BTC, with an average return of -2.95 percent since 2013. With August’s momentum carrying into the month, we expect that any intra-month correction leaves the odds in favour of continuation higher on the higher timeframes.
Bitcoin Has Historically Been a Momentum-Driven Asset
The week ending 23 August delivered a $14,833 gain, breaking through a previously-set resistance level and marking the largest weekly dollar expansion in the asset’s history. This print stands $3,275 above the prior record for a weekly gain established in November 2024. The 23.6 percent appreciation represents the sharpest weekly climb since March 2023.
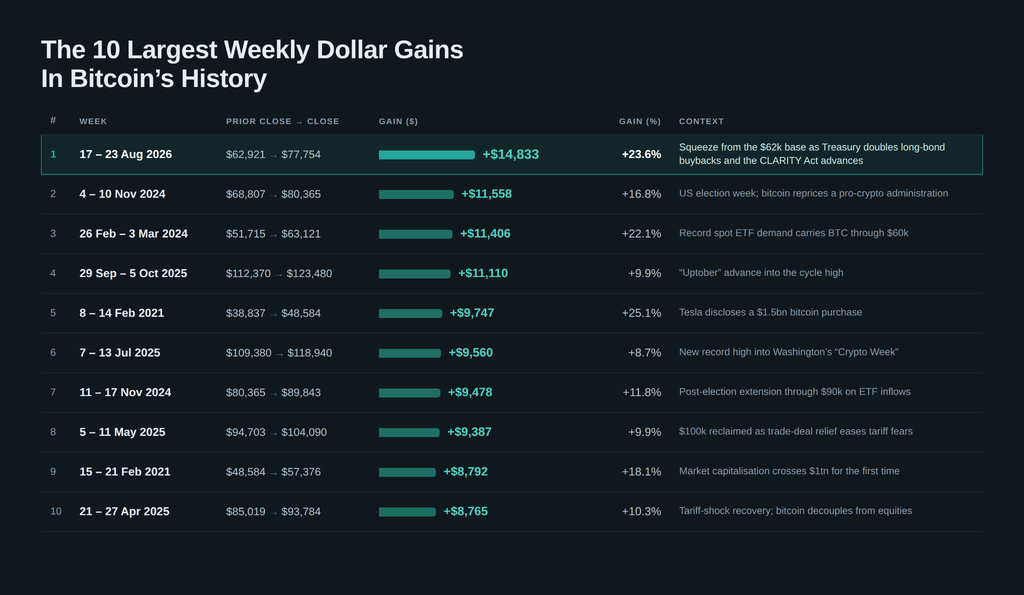
Momentum has extended past the initial short squeeze and persisted without a retracement in the subsequent window. The historical record since 2020 identifies 17 weekly gains exceeding 15 percent. On a rolling 30 day basis, BTC was higher in 14 of those instances, with a median return of 8.4 percent.
The data points to a high probability of follow-through after higher timeframe performances of this magnitude. Macro tailwinds may temper that, but our view remains that pullbacks should be short lived and limited in scale for as long as price sustains above the former $68,000 range highs.
The Buyers Swapped Seats
The largest corporate holder of bitcoin, Strategy, also returned to the market during the exact sessions in which the market was consolidating, with buying momentum running into passive sellers above $77,000, a level confluent with the True Market Mean.
Strategy’s Monday filing recorded 4,603 BTC bought for $369.7 million at an average of $80,318, purchased from 24 to 30 August. It was the company’s first purchase in 10 weeks and takes holdings to 845,050 BTC at an average cost of $75,412. Funded from at-the-market equity sales, the purchase also clarifies the purpose of Strategy’s previous share and BTC sales. It appears that the company’s cash pool, disclosed a week earlier, was a buyer’s reserve and roughly a quarter of it was converted into BTC within one filing cycle.
The average purchase price of $80,318 also sits above every daily close since 14 May, placing the accumulation inside the above-$79,000 rejection band. In other words, Strategy is buying at a level the broader market is currently rejecting.
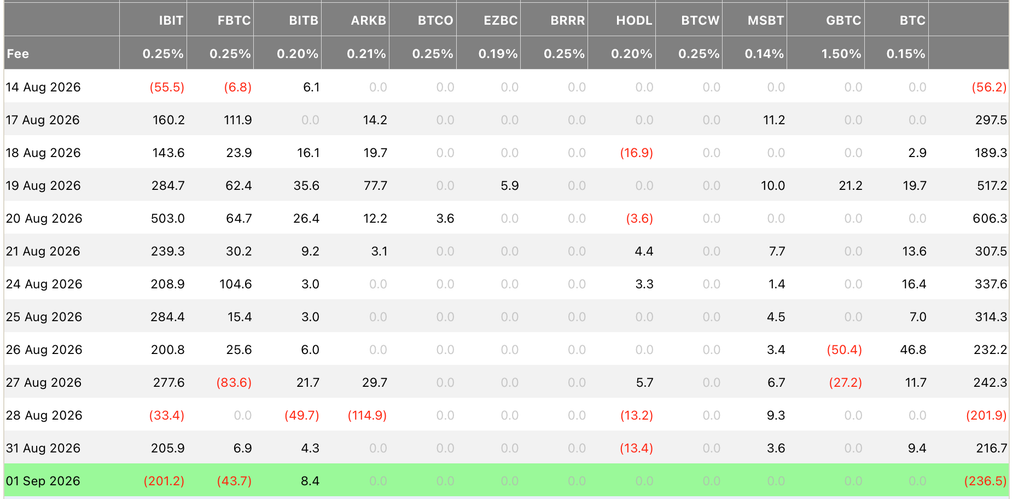
Institutional appetite expressed through the BTC Exchange Traded Fund (ETF) complex paused for a single session last week. Prevailing macro headwinds suggest a more measured participation ahead. A nine-session, $3.04 billion accumulation streak concluded with a $201.9 million redemption on 28 August when Warsh delivered his comments, but was then followed by a $216.7 million recovery on Monday. BlackRock’s IBIT accounted for $205.9 million of that return, continuing its leadership of the August rally.
September, however, opened with a $236.5 million outflow yesterday (1 September), primarily driven by IBIT, indicating that the most aggressive phase of the bid may be entering a temporary cooling period.
Conversely, spot Ether ETFs have maintained their resilience. After securing $815.7 million last week with no missed session since 17 August, they extended their uninterrupted inflow streak to 13 days as of September 1, albeit at a more modest pace.
A structural hand-off is underway in the liquidity engines that powered the squeeze. Strategy’s corporate treasury purchases have helped offset the slowdown in BTC product demand, while the ETH investment vehicle continues to attract consistent inflows.
The dollar rail beneath both complexes has paused with the price. The aggregate stablecoin market cap, which grew by $1.25 billion before Warsh’s comments, peaked at $309.4 billion on 28 August and stands at $303.83 billion today.
Stablecoins are the settlement dollars of the crypto market. Their market cap expands when new money is being staged for deployment and stalls when that money waits. A pipeline that grew every day through a 21 percent advance and stopped growing on the day the Fed turned more hawkish on rates, points to new money pausing at the point of entry rather than capital exiting, since redemptions would show the float shrinking outright.

The Book is Pinned at Break-Even
The cohort currently selling is likely to be doing so at cost. The long-term holder Spent Output Profit Ratio (SOPR), the ratio of the price at which long-held coins are spent versus the price at which they were acquired, has now straddled 1 for nine consecutive sessions, oscillating between 0.88 and 1.19 with the current level at 0.98.
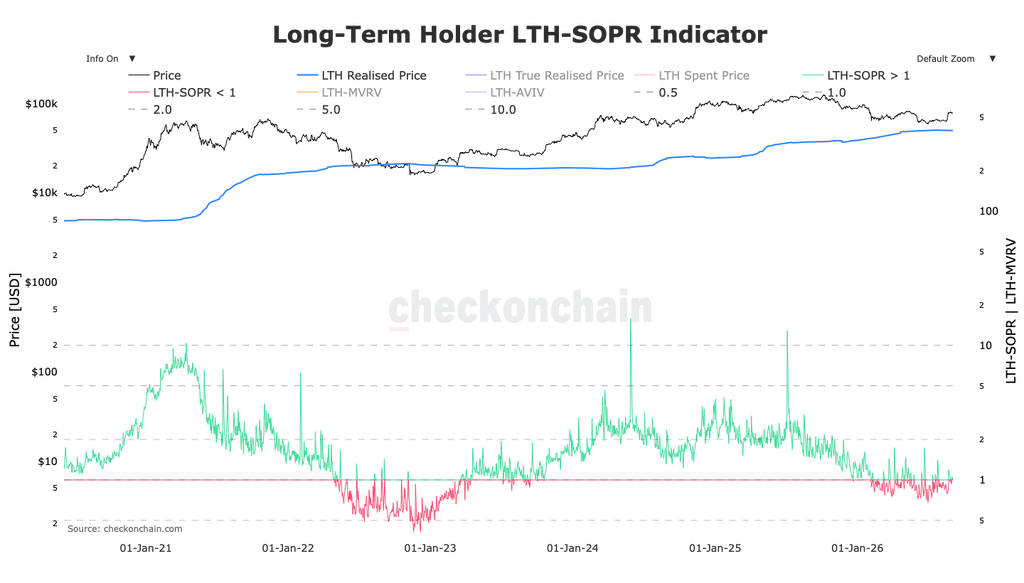
An average spent coin moving within a few percent of what the holder paid for it, day after day, identifies the seller precisely: buyers from February and March who bought near these levels waited out the drawdown and are now taking the first opportunity to exit at breakeven.
Only two readings could invalidate this view: sustained prints below 0.9 on a falling price would mean sellers are once again accepting losses to get out, the behaviour of a market that is breaking; or sustained prints above 1.1 indicating that holders with real gains are cashing out into strength. What the tape shows instead is a patient seller, active only near their own break-even price and, for five sessions running, fully absorbed by the bid.
Why is price pinned to the True Market Mean specifically? The supply data gives the answer in size. When BTC closed at $80,256 on 27 August, 72.1 percent of all supply was in profit. By Tuesday’s close at $77,468, that share was 67.7 percent. Roughly 880,000 BTC therefore carry a cost basis inside that $2,800 window, right where the market is trading now.
Every move through this zone flips a large block of supply between profit and loss and each flip changes how holders behave, which keeps the market negotiating these prices.
The short-term holder cost basis stands at $69,980 but is climbing roughly $300 a day as short-sellers are squeezed out. On deeper pullbacks, we expect this former resistance band to act as support as supply dynamics come into focus.
The Insurance Carries a Date and a Price
Implied volatility is the price of an option expressed as an expected range of movement. Higher prices reflect a market that expects large swings. Lower prices reflect more subdued volatility.
Overall average volatility is at 37.2, its sixth consecutive session between 37 and 38. This puts it in the 18th percentile of the past year’s daily closes, meaning options have been cheaper than this on fewer than one day in five over the last 12 months, with the current year low at 33.8. This level was reached only recently, when price was ranging between $60,000-68,000 and hit the current bear market low on 1 July.
IV currently sits below the trailing 30 day realised volatility of roughly 41 percent, so option sellers are pricing in less volatility for September than the last month delivered. A market that moved 21 percent in three sessions a fortnight ago is now priced in the bottom fifth of its yearly volatility range, suggesting traders expect the current compression to persist as macro tailwinds fade and rate-hike risk weighs on risk assets.
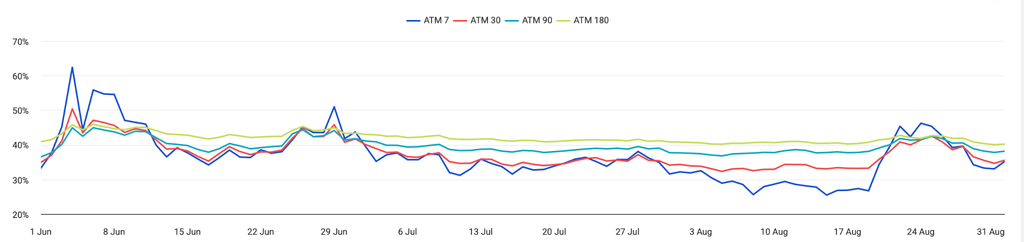
The current cost of a potential rate rise is reflected in the straddle: buying both a call and a put at the strike nearest spot, a position that pays if price moves far enough in either direction.
One timing detail matters: crypto options expire at 08:00 UTC, hours before the 12:30 UTC payrolls release due on 4 September, so the straddle expiring this Friday, at $1,519, prices only the wait.
The first expiry that actually contains the release is 11 September. Its straddle costs $3,208, a 4.13 percent breakeven for a window holding payrolls, the Producer Price Index (PPI) and seven ordinary sessions.
The 2026 record gives that price its context. Across the year’s eight payrolls releases, bitcoin’s release-day move averaged 1.9 percent, so the market is charging roughly two average payrolls days for nine days of data risk. Four of the eight releases moved the market less than one percent. The other four moved it 2.4 to 4.4 percent. Payrolls either confirms what the market already believes and passes quietly, or it changes the Fed conversation and the repricing arrives at once. With hike odds near two-thirds and strong data now read as hawkish, this release carries the conditions that produced the loud half of that record.
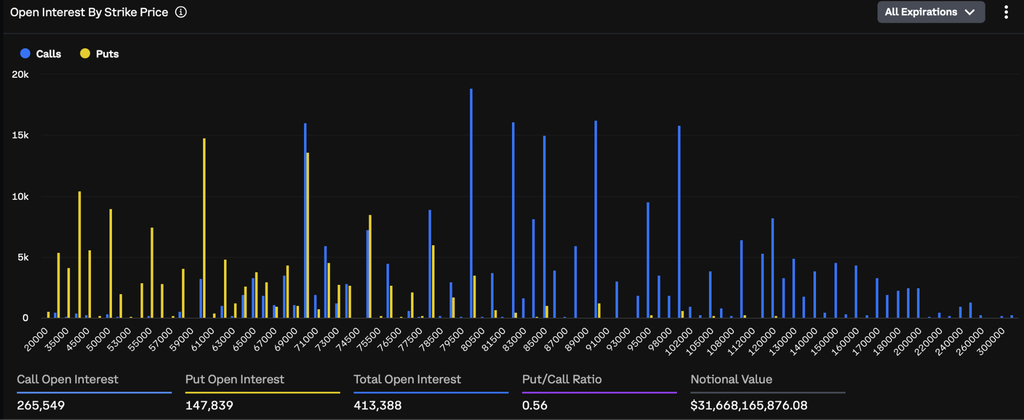
Where the protection sits is as informative as what it costs. The options market holds 0.56 puts per call overall, and the large September quarterly just 0.52.
The 11 September expiry is the outlier at 1, the only board where downside protection matches upside participation one for one, the same pre-event signature the 28 August expiry showed before Warsh’s comments. Those puts are struck between $68,000 and $75,000, with the largest overall call open interest at $80,000 and at $75,500 for puts, which is within the ranges we have outlined already.
In plain terms:
- Volatility is priced near its cheapest of the year, two days before a release that can affect a Fed decision given that rate hike odds are nearing 66 percent right now. The window that contains it costs $3,208 of movement, roughly two average payrolls days for nine sessions of data risk.
- The downside protection that exists is dated to the payrolls to Consumer Price Index (CPI) window and struck between $68,000 and $75,000. This is the same support level our roadmap names, which reads as holders insuring a position they intend to keep.
- The upside is held in fixed premium calls above the shelf, while perpetual leverage stays 10 percent below its August peak. The book is positioned for a break higher without paying liquidation risk to wait for it.
Roadmap and Our Stance
The three scenarios that we published on 26 August survived the week with one amendment. The base case named consolidation between $77,100 and $81,300, and two of the five closes have printed marginally below that band’s floor. However, actual market dynamics are not based around fixed prices but levels are meant to be treated as zones with multiple levels of confluence, with the True Market Mean near $76,350 coming into consideration as the pivot the market is organising around. It is also a rough region representing average holder cost basis rather than a floor it must defend to the dollar.
| Scenario | Activation | Path and target | Invalidation |
| A. Acceptance | Two daily closes above $82,818 with aggregate SOPR above 1.0 and green ETF prints on both days | Shelf converts to support; next cost-basis reference ~$85,200 | Rejection wick back below $81,300 on the second day |
| B. Base case | In force: closes between $76,657 and $81,300, pinned near TMM ~$77,900, through the 4 to 11 September data window | Compression resolves with the data; ETF prints and LTH-SOPR at the mean decide direction | Two daily closes below $76,657 |
| C. Retrace | Two daily closes below $76,657 | $73,500 (three-to-six-month cost basis), then $69,980 STH cost basis | Reclaim of TMM within two sessions |
Key Levels and Signals
| Metric | Reading | Bullish signal | Bearish signal |
| True Market Mean | $76,350 | Holding at or above the mean | Sustained closes below, unreclaimed |
| LTH-SOPR | 0.98; nine sessions straddling 1.0 | Above 1.0 with price holding the mean | Below 0.9 on a falling price |
| 11 Sep put/call OI | 1.00 vs 0.56 for the book | Puts roll off post-payrolls, front RR stable | Front RR deepens below -2 with DVOL above 42 |
| ETF daily flows | +$216.7m Monday; Tuesday partial -$236.5m | Green week | Redemptions on the data days |
| September hike odds | ~66 percent (FedWatch, 31 Aug) | Below 50 on a weak payrolls print | Above 60 through payrolls with 2Y above 4.40 |
| Brent crude | ~$95, highest in nearly six weeks | Fades below $90 before CPI week | Holds above $95 into the 11 Sep CPI |



Be the first to comment