



Signal of the week: Bitcoin’s 7-day net realized profit/loss turned positive for the first time in two months, while realized losses fell to their lowest level since late May. The improvement was driven primarily by short-term holders, suggesting fewer recent buyers are capitulating despite Bitcoin remaining below the short-term holder cost basis.
Bitcoin’s price remained range-bound, but market conditions continued to improve beneath the surface. Realized losses declined sharply, ETF inflows remained positive, and liquidation activity eased further, indicating that broad market stress continues to fade. However, with Bitcoin approaching the short-term holder cost basis at $68,000, the market is entering a phase where profit-taking could become the next major obstacle for the recovery.
About the Bitcoin Impact Index
The Bitcoin Impact Index measures which groups of Bitcoin holders are under financial stress, how severe that stress is, and whether it’s severe enough to shake confidence in the market’s direction. It combines on-chain holder behaviour, ETF and derivatives activity, and exchange-level liquidity flows into a single weekly score between 0 and 100. Unlike sentiment indicators, it deliberately excludes social media and volume data to focus on what participants are doing rather than what they are saying.
Score bands:

- Normal Rotation (0–24) — routine profit-taking, no structural shift
- Elevated Repositioning (25–49) — specific groups shifting positions, pressure uneven across the market
- High Impact (50–74) — broad stress across multiple holder groups and institutional flows simultaneously
- Critical Impact (75–100) — full capitulation: LTH losses, large ETF outflows, major liquidations, and heavy exchange inflows at once
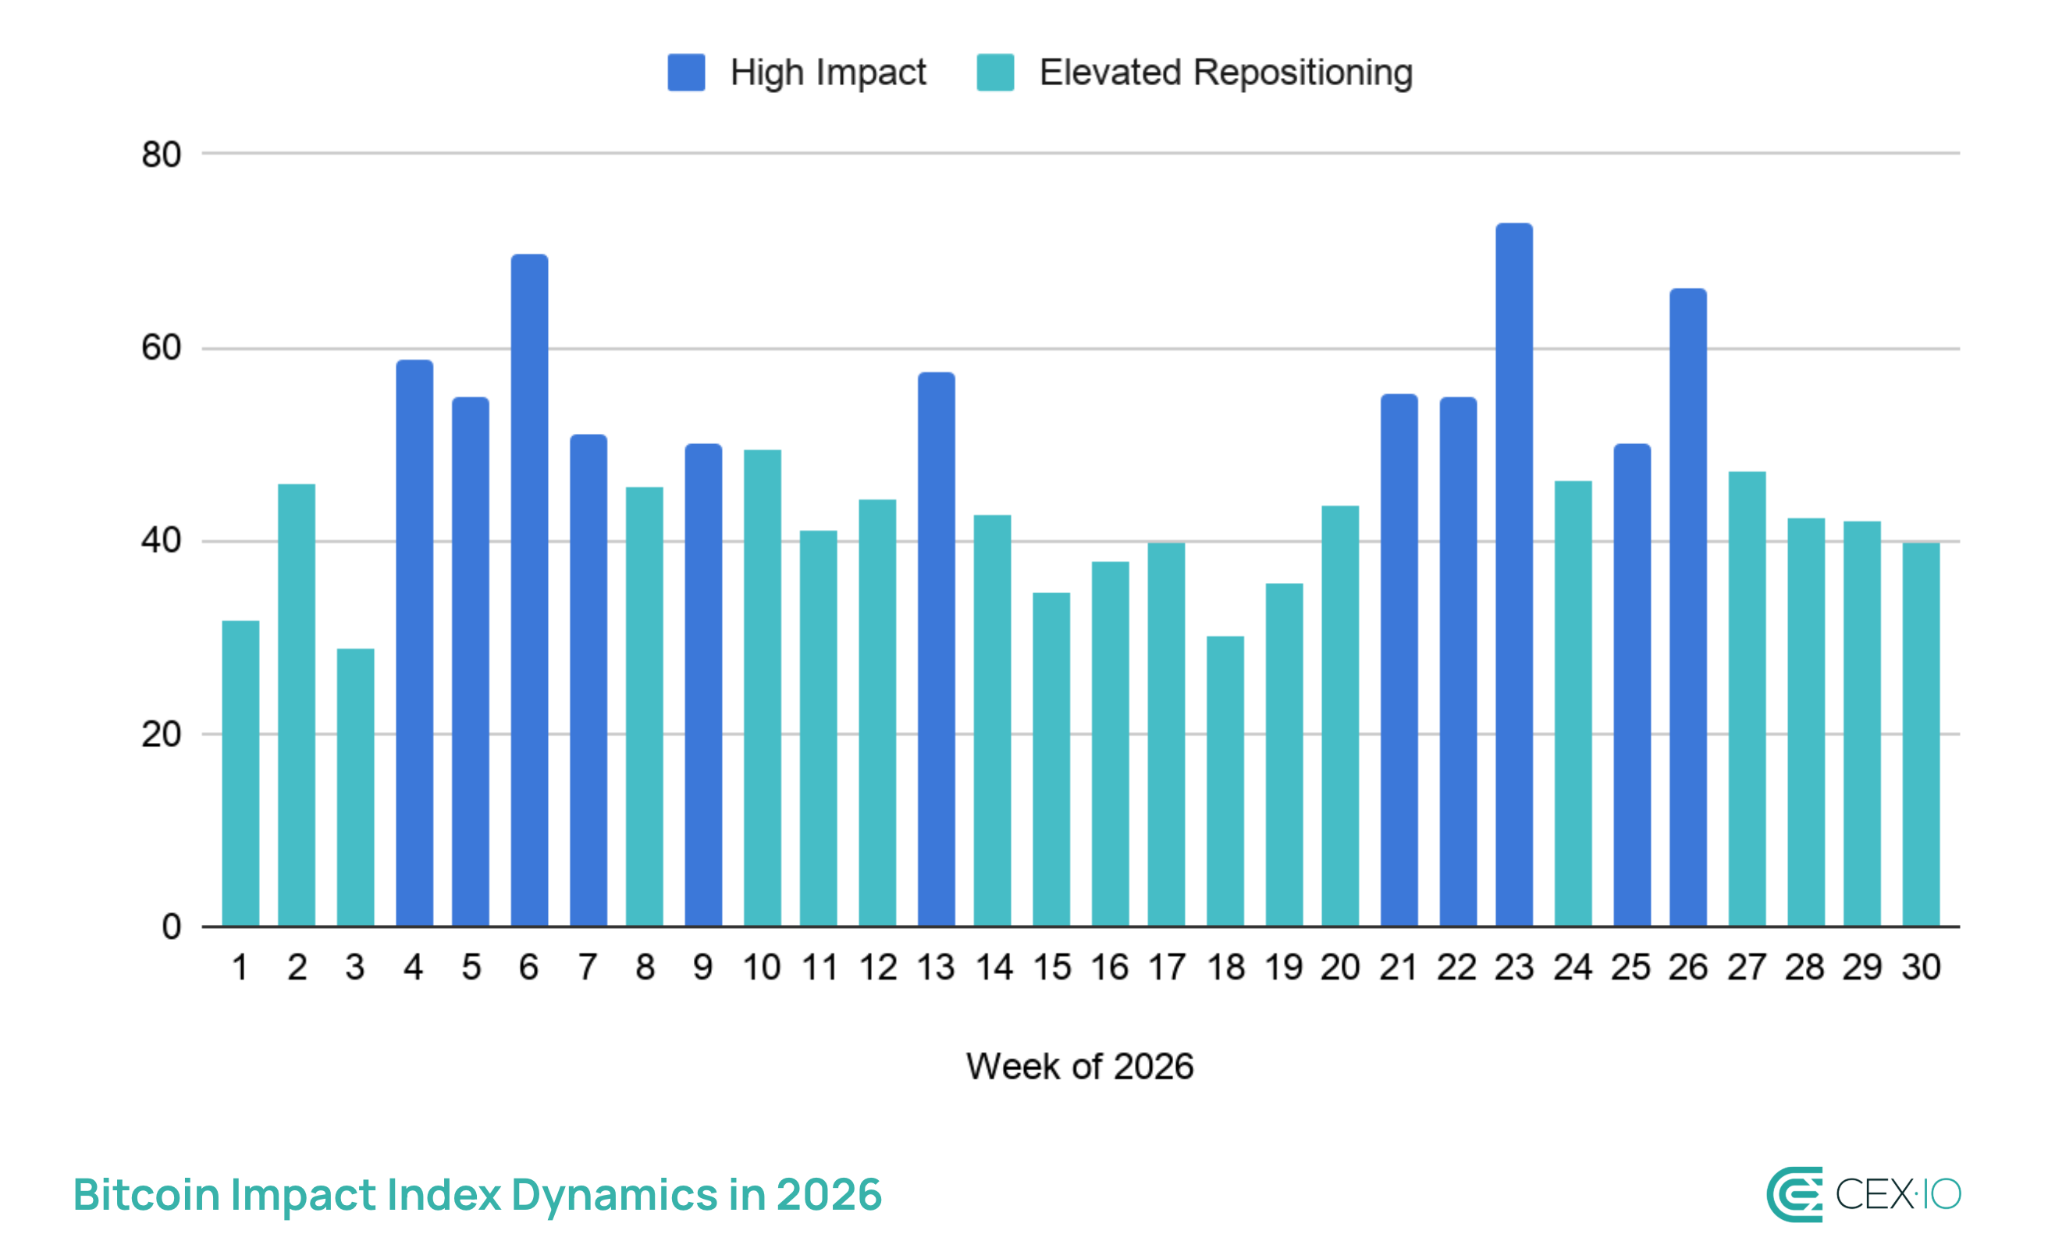
Week 30 (July 20–26): BII 39.6 — Elevated Repositioning
Positive signals: the selling pressure is draining away
Bitcoin’s 7-day realised losses dropped to around $231 million, the lowest level in two months, while realised loss per unit of liquidity declined sharply from 54.5% to 17.8%. At the same time, the 7-day net realised profit/loss turned positive for the first time since late May, suggesting that the market is gradually transitioning from widespread loss realisation to profit-taking.
Institutional demand also remained supportive. Spot Bitcoin ETFs recorded another week of positive net flows, adding $33.8 million, while both long and short liquidations fell to around $18 million per day. The continued decline in liquidation activity suggests leverage has largely reset, reducing the likelihood of another wave of forced selling.
Negative signals: short-term holder pressure continues building below $68,000
Although overall selling pressure has eased considerably, Bitcoin is approaching an area where it may significantly increase.
Around 85% of all unrealised value held by short-term holders still consists of losses, as Bitcoin remains below the $68,000 short-term holder cost basis. As the price moves closer to this level, many recent buyers may look to exit at break-even, creating additional selling pressure. That’s one of the reasons why Bitcoin’s move above $67,000 was relatively short last week.
While this behaviour would represent a healthy market rotation rather than panic selling, it could still slow the recovery if demand is not strong enough to absorb the incoming supply.
Mixed signals: Bitcoin volatility continues to compress
Bitcoin’s market structure continues shifting into a “wait-and-see” mode. Weekly realized volatility declined to its lowest level in two months, while three-month realized volatility dropped to its lowest level since Bitcoin’s all-time high in October 2025. At the same time, the daily Choppiness Index climbed to 66, its highest reading in two months.
Historically, prolonged periods of low volatility and elevated choppiness have often preceded rapid directional moves.
Long-term holders also continued strengthening their position, with their supply increasing by roughly 6,000 BTC over the past week. While the increase remains relatively modest, it reinforces the broader trend of supply gradually migrating into stronger hands.
What could happen next?
Bitcoin is currently hovering around $64,000, where both the middle band of the daily Bollinger Bands and the 0.236 Fibonacci retracement are located. And $68,000 remains the key level to watch. A successful move above this level would return many recent buyers to profitability, but it could also trigger a wave of selling pressure.
If Bitcoin manages to reclaim $68,000 without significant selling pressure, it would suggest that short-term holder supply is being successfully absorbed and strengthen the case that the cycle bottom may already be in place. However, if the level acts as strong resistance, Bitcoin could remain range-bound for longer. On the downside, a break below $64,000 would shift attention toward the 200-week SMA and the $62,000 support zone.
The web content provided by CEX.IO is for educational purposes only. The information and tools provided neither are, nor should be construed as, an offer, or a solicitation of an offer, or a recommendation, to buy, sell or hold any digital asset or to open a particular account or engage in any specific investment strategy. Digital asset markets are highly volatile and can lead to loss of funds.
The availability of the products, features, and services on the CEX.IO platform is subject to jurisdictional limitations. To understand what products and services are available in your region, please see our list of supported countries and territories. This page includes additional links to information about individual products, and their accessibility.



Be the first to comment