


What to know:
- Bitcoin is testing the key $75,846 support level amid a controlled pullback and weakening short-term momentum.
- Despite the dip, RSI above signal levels and the MA ribbon support suggest the underlying bullish structure remains intact.
- Early MACD bullish crossover hints at potential recovery, but holding above $75,846 is critical for stability.

Bitcoin is currently at a crucial level of technical support amid the indecisiveness of momentum that appears to be in favor of a minor correction against ongoing buying pressures. Investors will now have to observe if the levels will continue to defend against the current pullback.
At press time, Bitcoin is trading at $76,198, with a 24-hour trading volume of approximately $51.37 billion and a total market capitalization near $1.52 trillion, according to CoinMarketCap. Over the last 24 hours, BTC has declined by 1.57%, reflecting a controlled pullback after recent upward movement across the broader crypto market.

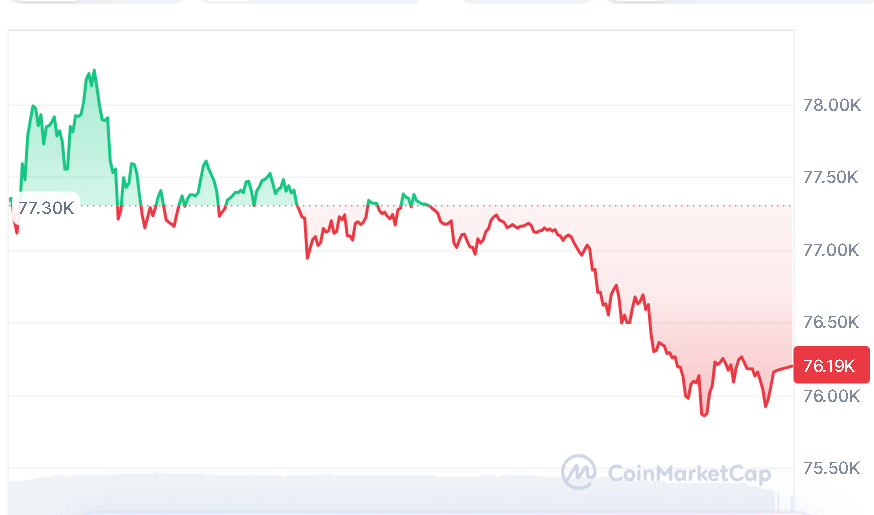
Source: CoinMarketCap

Also Read | Cardano (ADA) Shows Reversal as Key Support Retest Signals $1.19 Rally
Bitcoin Tests Support Amid Volatility
On April 18, 2026, crypto analyst More Crypto Online observed that Bitcoin was currently testing the critical support level. The breaking of the support level at $75,846 could be interpreted as a formation of the peak within the wave construction, either in wave (1) or wave (3).


Source: More Crypto Online’s X Post
External factors may also be having an impact on the current volatility, as evidenced by the analysis. The return of geopolitical uncertainty amid disruptions to global oil supplies, such as those involving the Strait of Hormuz, can also be considered one factor that could contribute to the prevailing volatility.
Bitcoin Holds Strong Market Structure
However, despite the drop, Bitcoin still exhibits elements of resilience in its structure. Currently, the RSI stands at 63.71, higher than its signal level of 59.35. This shows that there is still buying pressure in the market, even though there is some profit-taking.
Looking at the current trend, Bitcoin remains above the short-term moving averages of the MA Ribbon chart, which sits around the $71,272 and $70,238 levels. This indicates that the existing bullish momentum is intact and that buyers continue to defend dynamic support areas.

Source: TradingView
Nonetheless, the asset stays under the long-term moving averages of $74,459 and $86,788. The discrepancy means that even as short-term momentum gains stability, the overall trend is yet to enter an outright bullish mode.
Momentum Signals Show Early Signs of Recovery
Technical momentum indicators are favoring the buyers. The MACD line is starting to form a bull cross above its signal line, suggesting that the momentum is increasing. The histogram is also showing positive readings, pointing to buying pressure ahead.
In case the momentum is maintained, Bitcoin may test for higher resistance once again; however, remaining above $75,846 becomes very important to maintain the existing configuration.
This article contains market analysis and price predictions. These are not guarantees. Crypto markets are volatile. Always DYOR. Not financial advice.
Also Read | Filecoin Breakout Watch: $1 Base Could Fuel Massive Rally to $7 Levels

Be the first to comment