



As US 10-year bond yields broke out further to the upside, the US stock market saw a red day. In spite of this, Bitcoin was able to hold firm, with the bulls defending the key $83K level successfully. With the US 10-year bond yield moving ever closer to a 19 year high can the $BTC price continue to rise?
10-year yield in touching distance of 19-year high
Source: TradingView

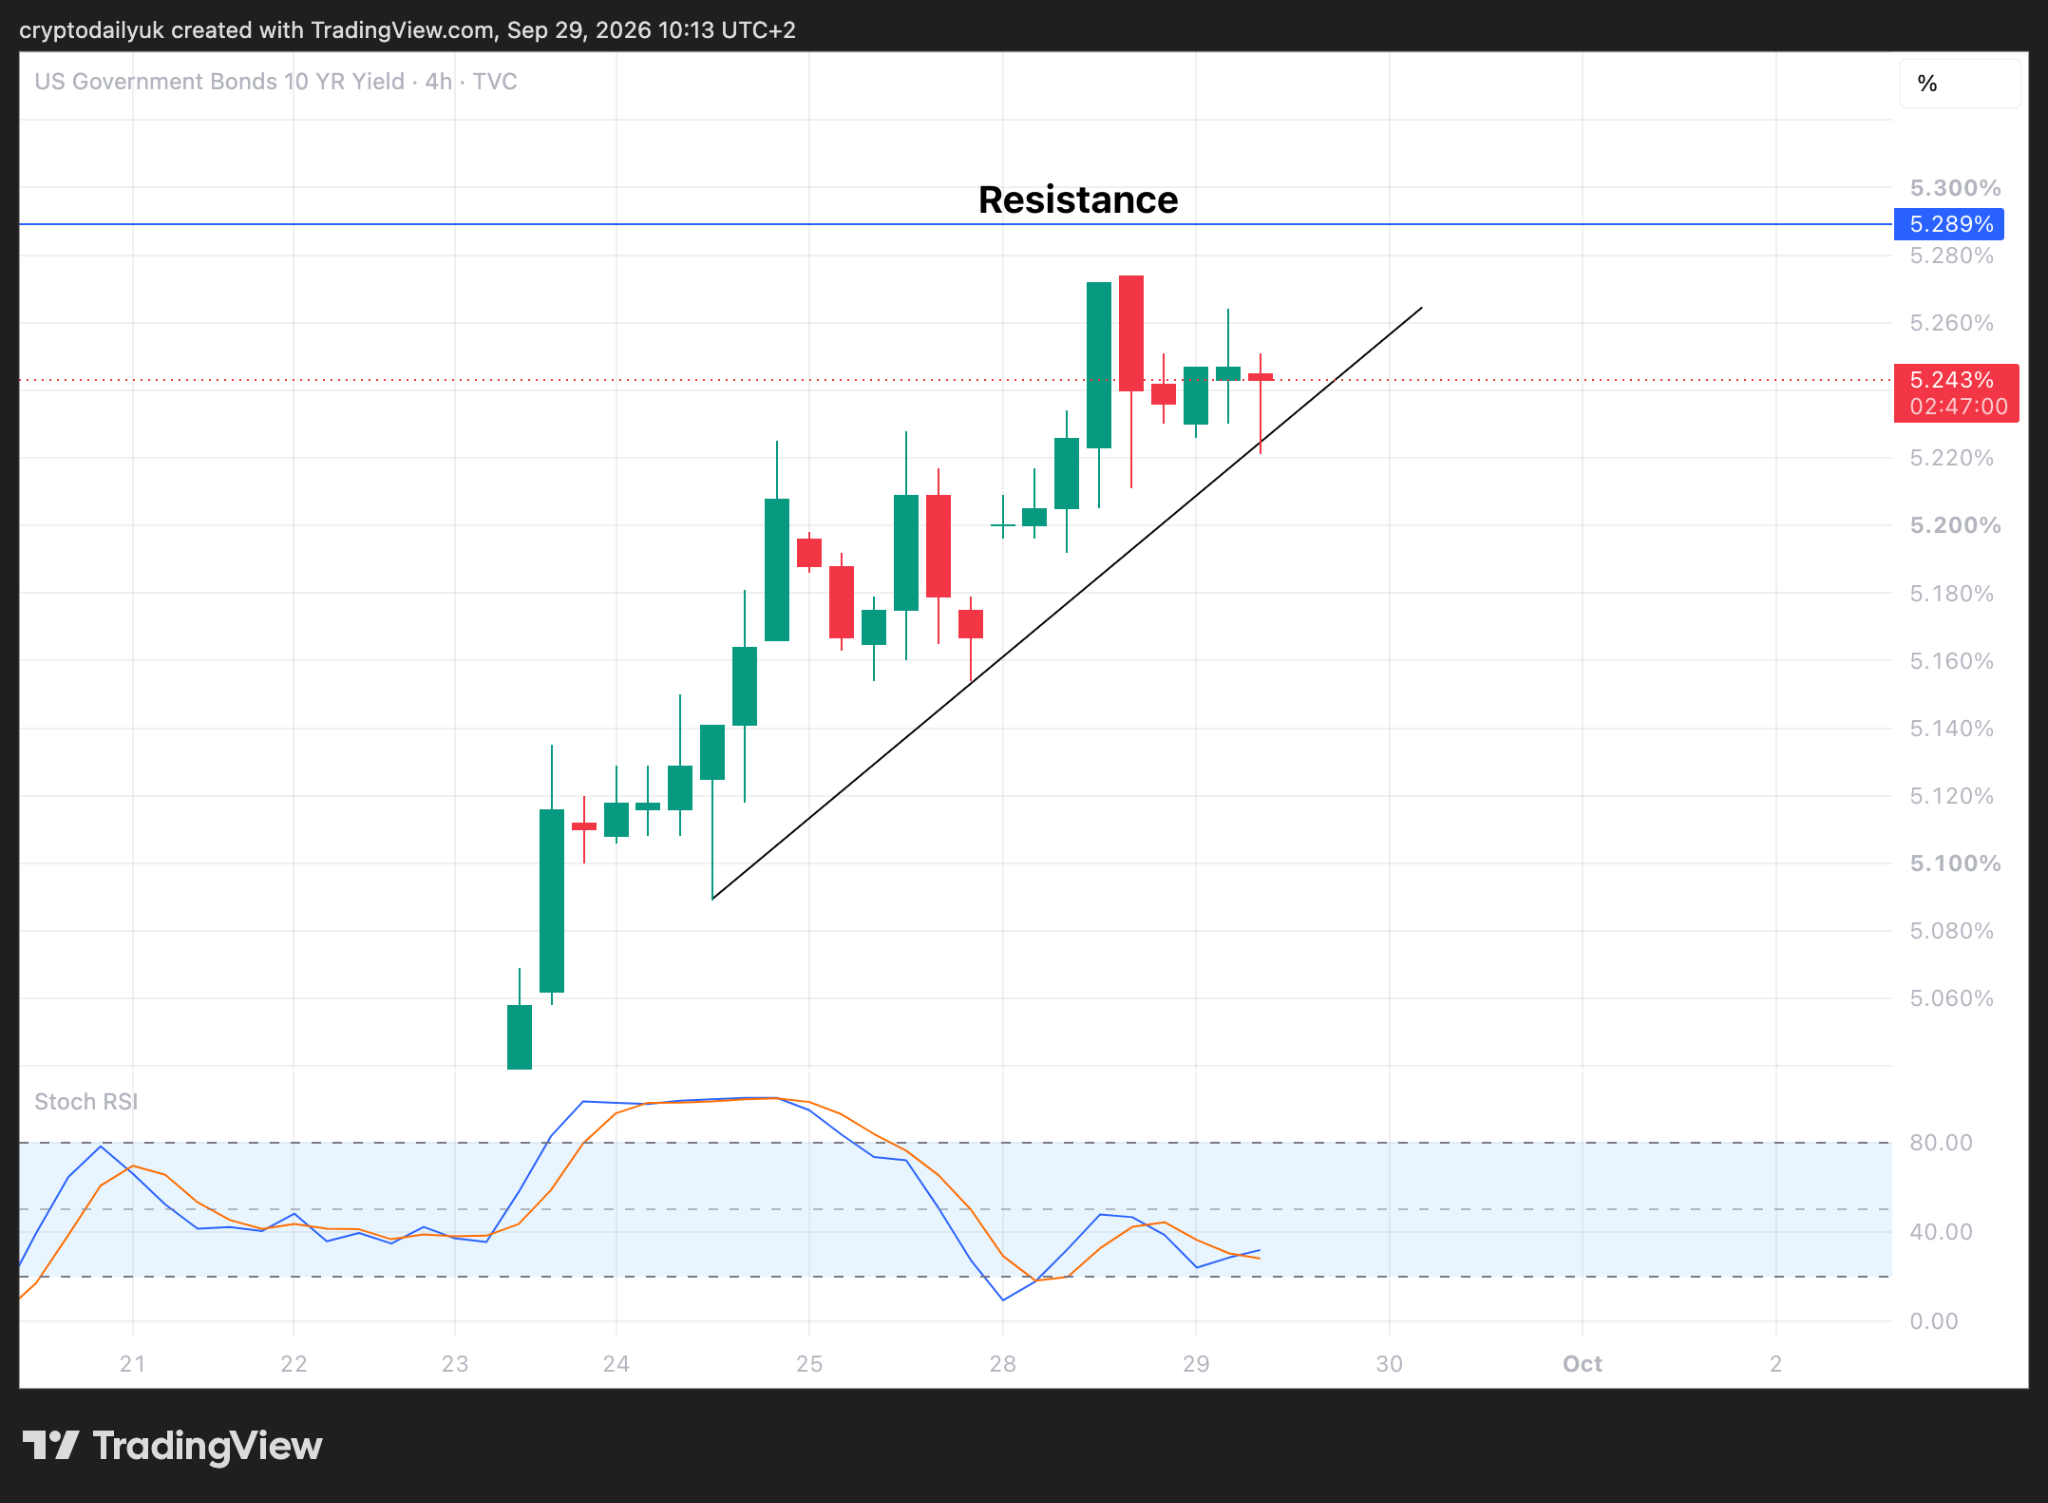
The 4-hour chart for the US Government 10-year bond yield reveals just how close the yield is to reaching a 19-year high. The 5.29% level could be reached on Tuesday or Wednesday.
Up then back down for the yield?
Source: TradingView
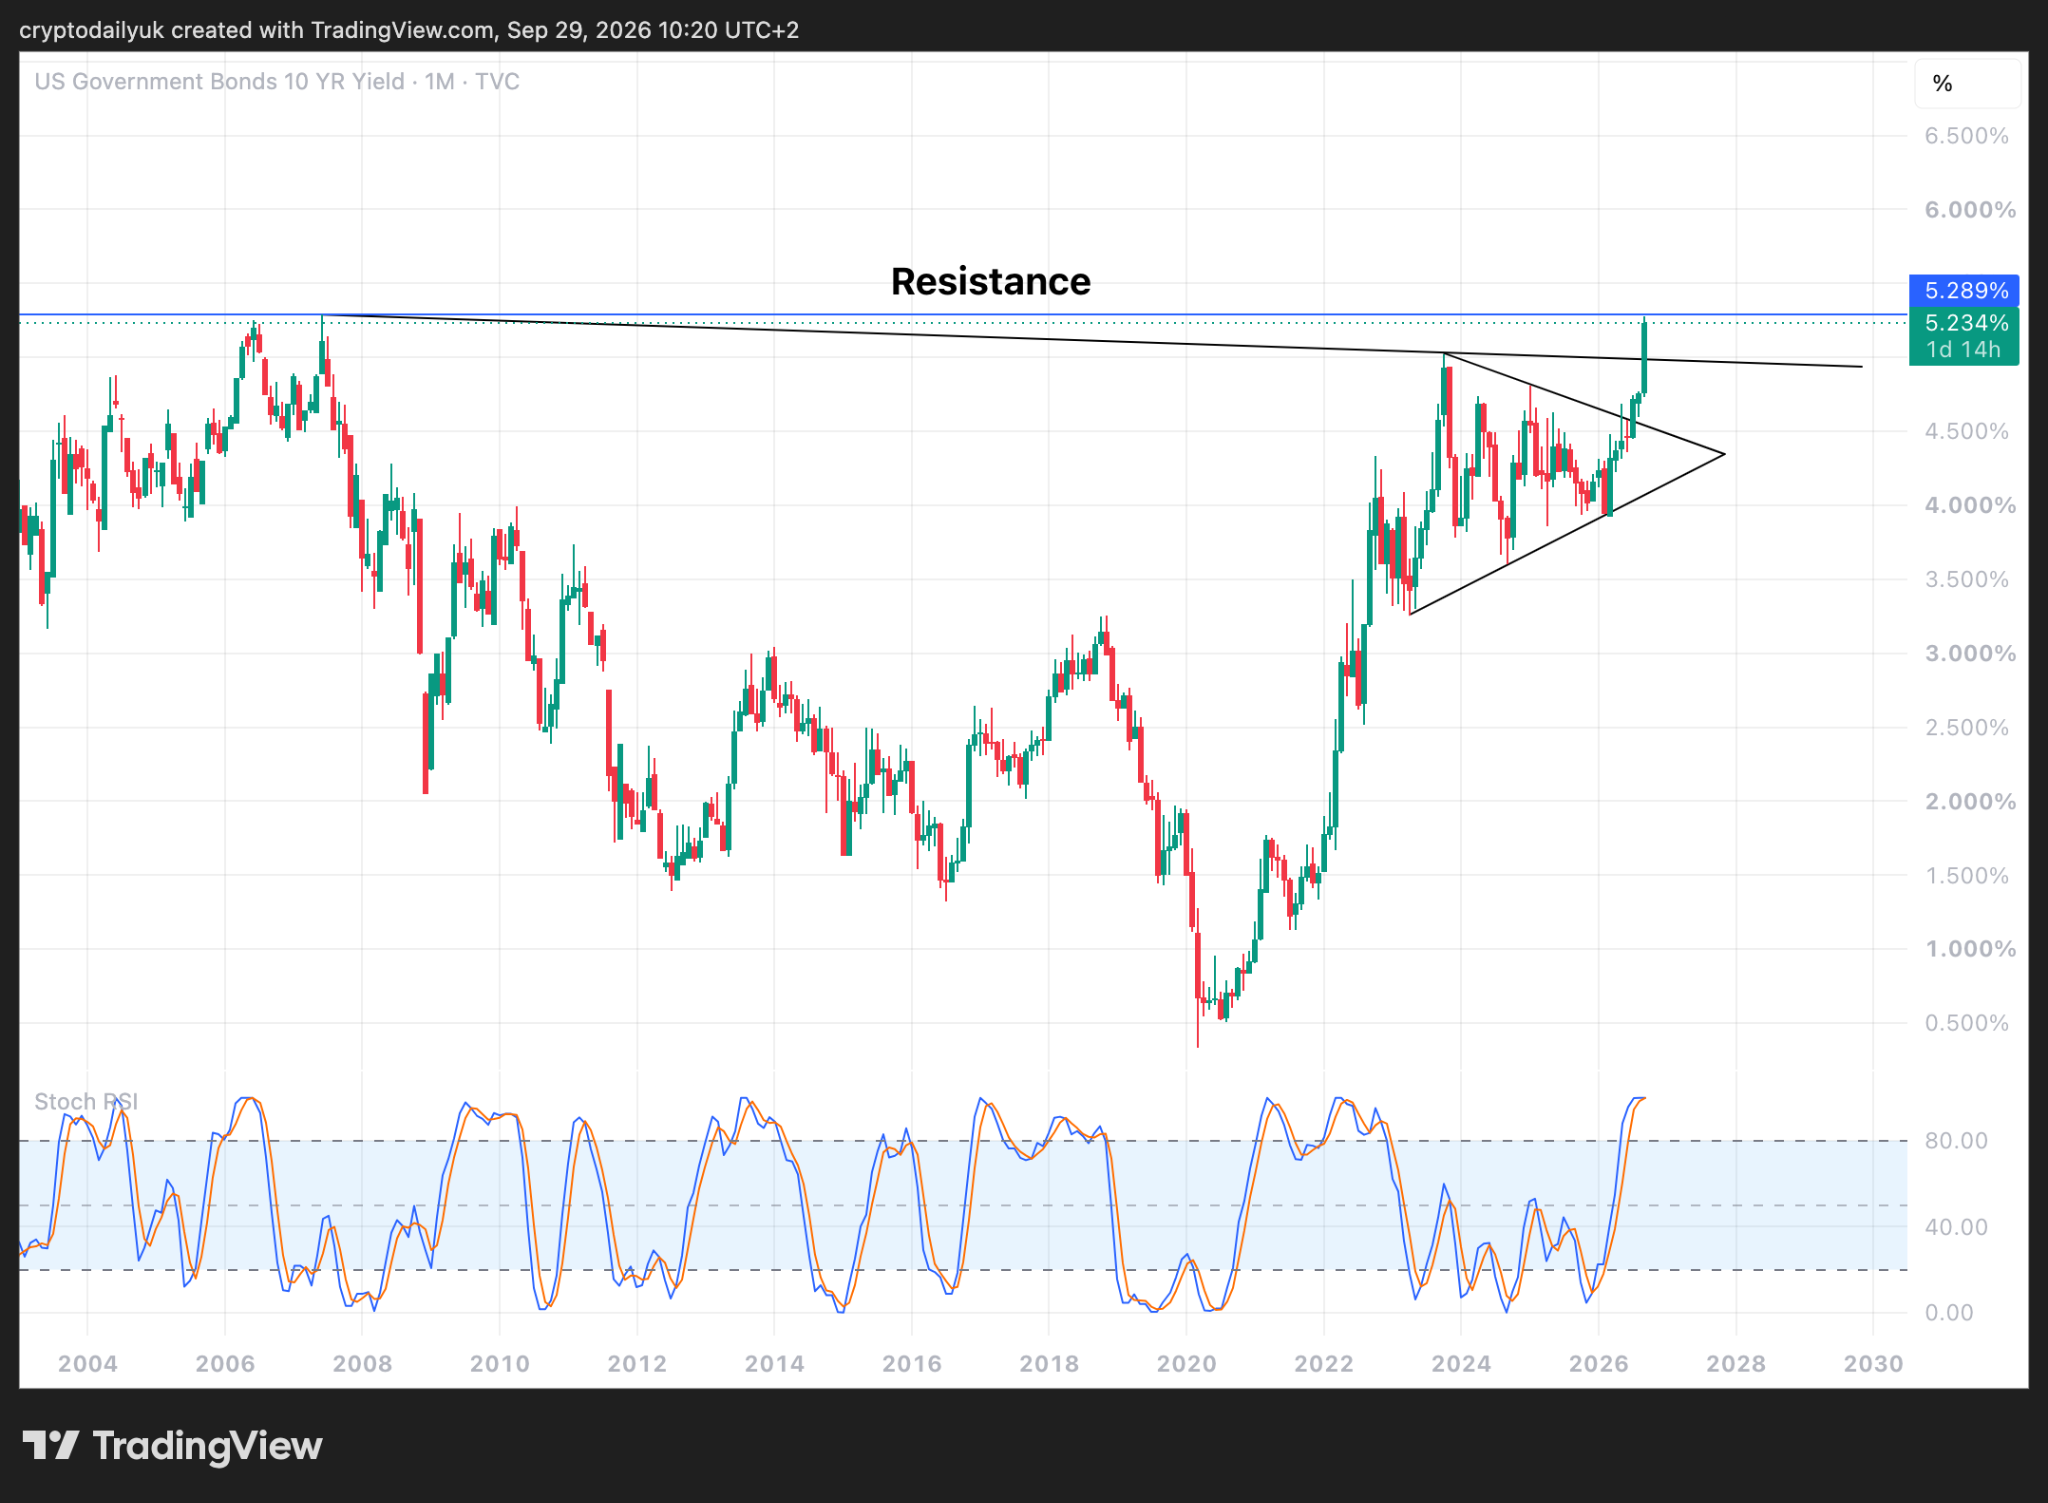
Zooming right out into the monthly time frame the last high can be seen. Is the 10-year yield about to surpass this high? The answer is quite possibly yes, although would the yield continue to climb? The Stochastic RSI indicators have reached the top of their limit, plus we have the double top. Therefore, at least from a technical analysis perspective, a descent to at least the descending trendline, and perhaps to the top of the triangle pattern, would be a next logical move.
$BTC price funnels into a descending triangle
Source: TradingView
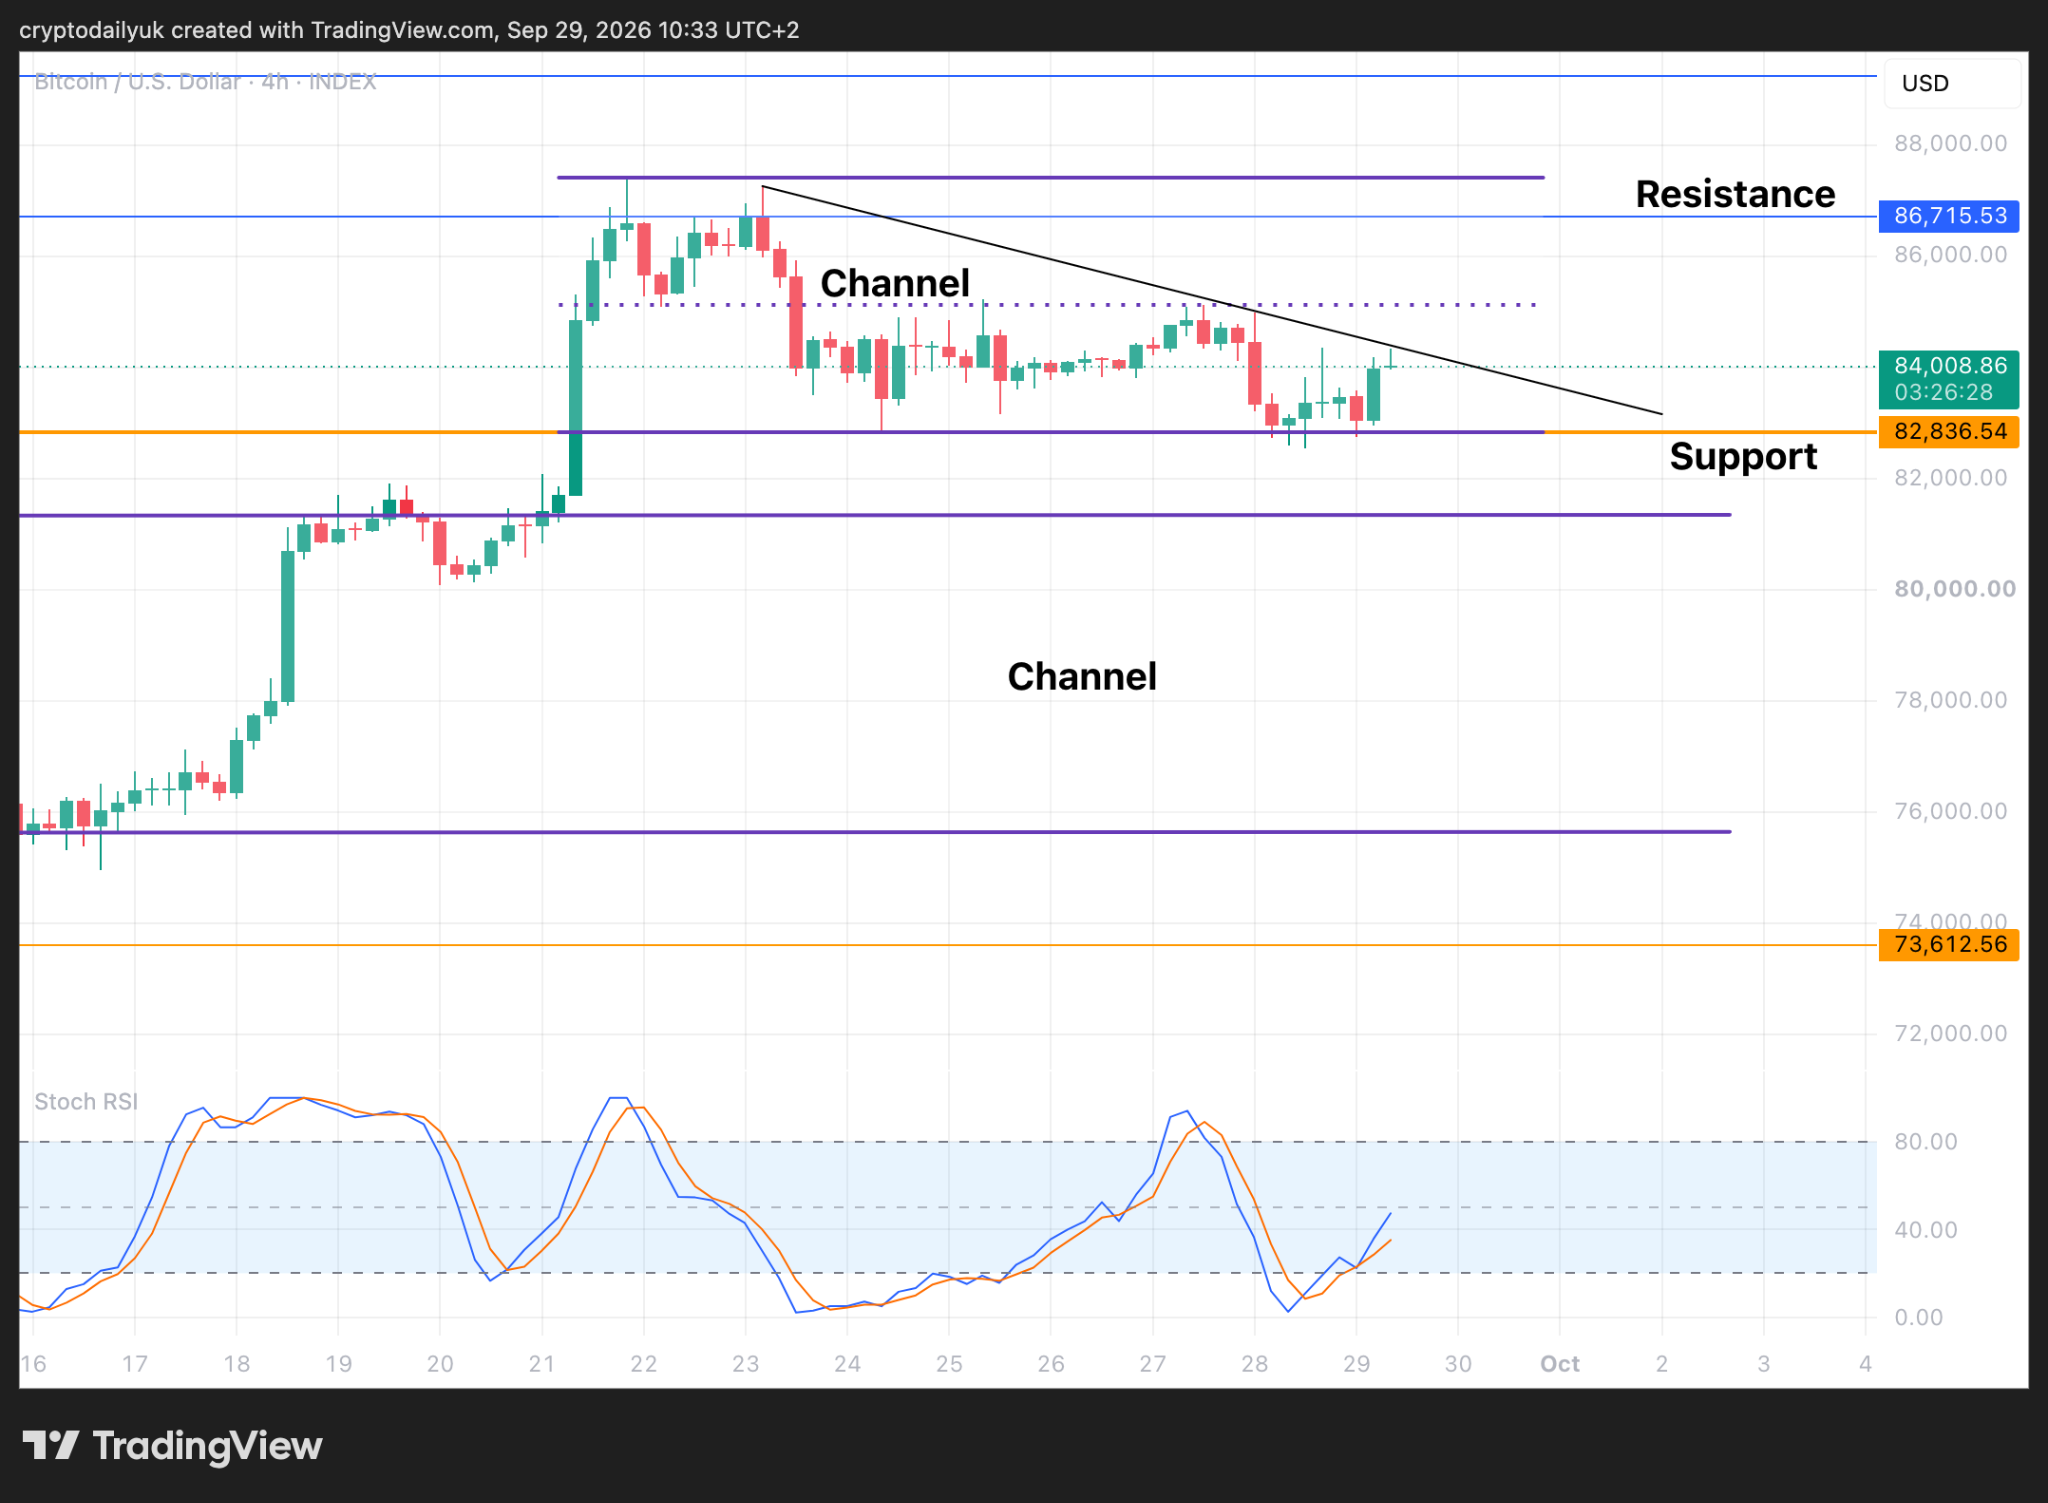
While the $BTC price is possibly in another channel, it also looks to be within a descending triangle. The price is currently being funnelled into the last third of this triangle and a breakout in either direction is probably going to happen soon. Given that the triangle is descending, it is generally bearish, although we will wait and see in which particular direction the price goes. It it’s to the downside, the top of the previous parallel channel will be support, while if it’s to the upside, first stop would be at the midpoint of the channel (dotted line), and then horizontal resistance at $86,700 and the opportunity to break out of the top of the channel.
If the 10-year yield continues its drive up to 5.29%, stock markets, gold, and risk assets like Bitcoin are probably going to suffer. Therefore, any trades would need to bear this in mind. In fact, trading in this environment would probably be a lot more unpredictable than usual.
$BTC at decision point for breakdown or breakout
Source: TradingView
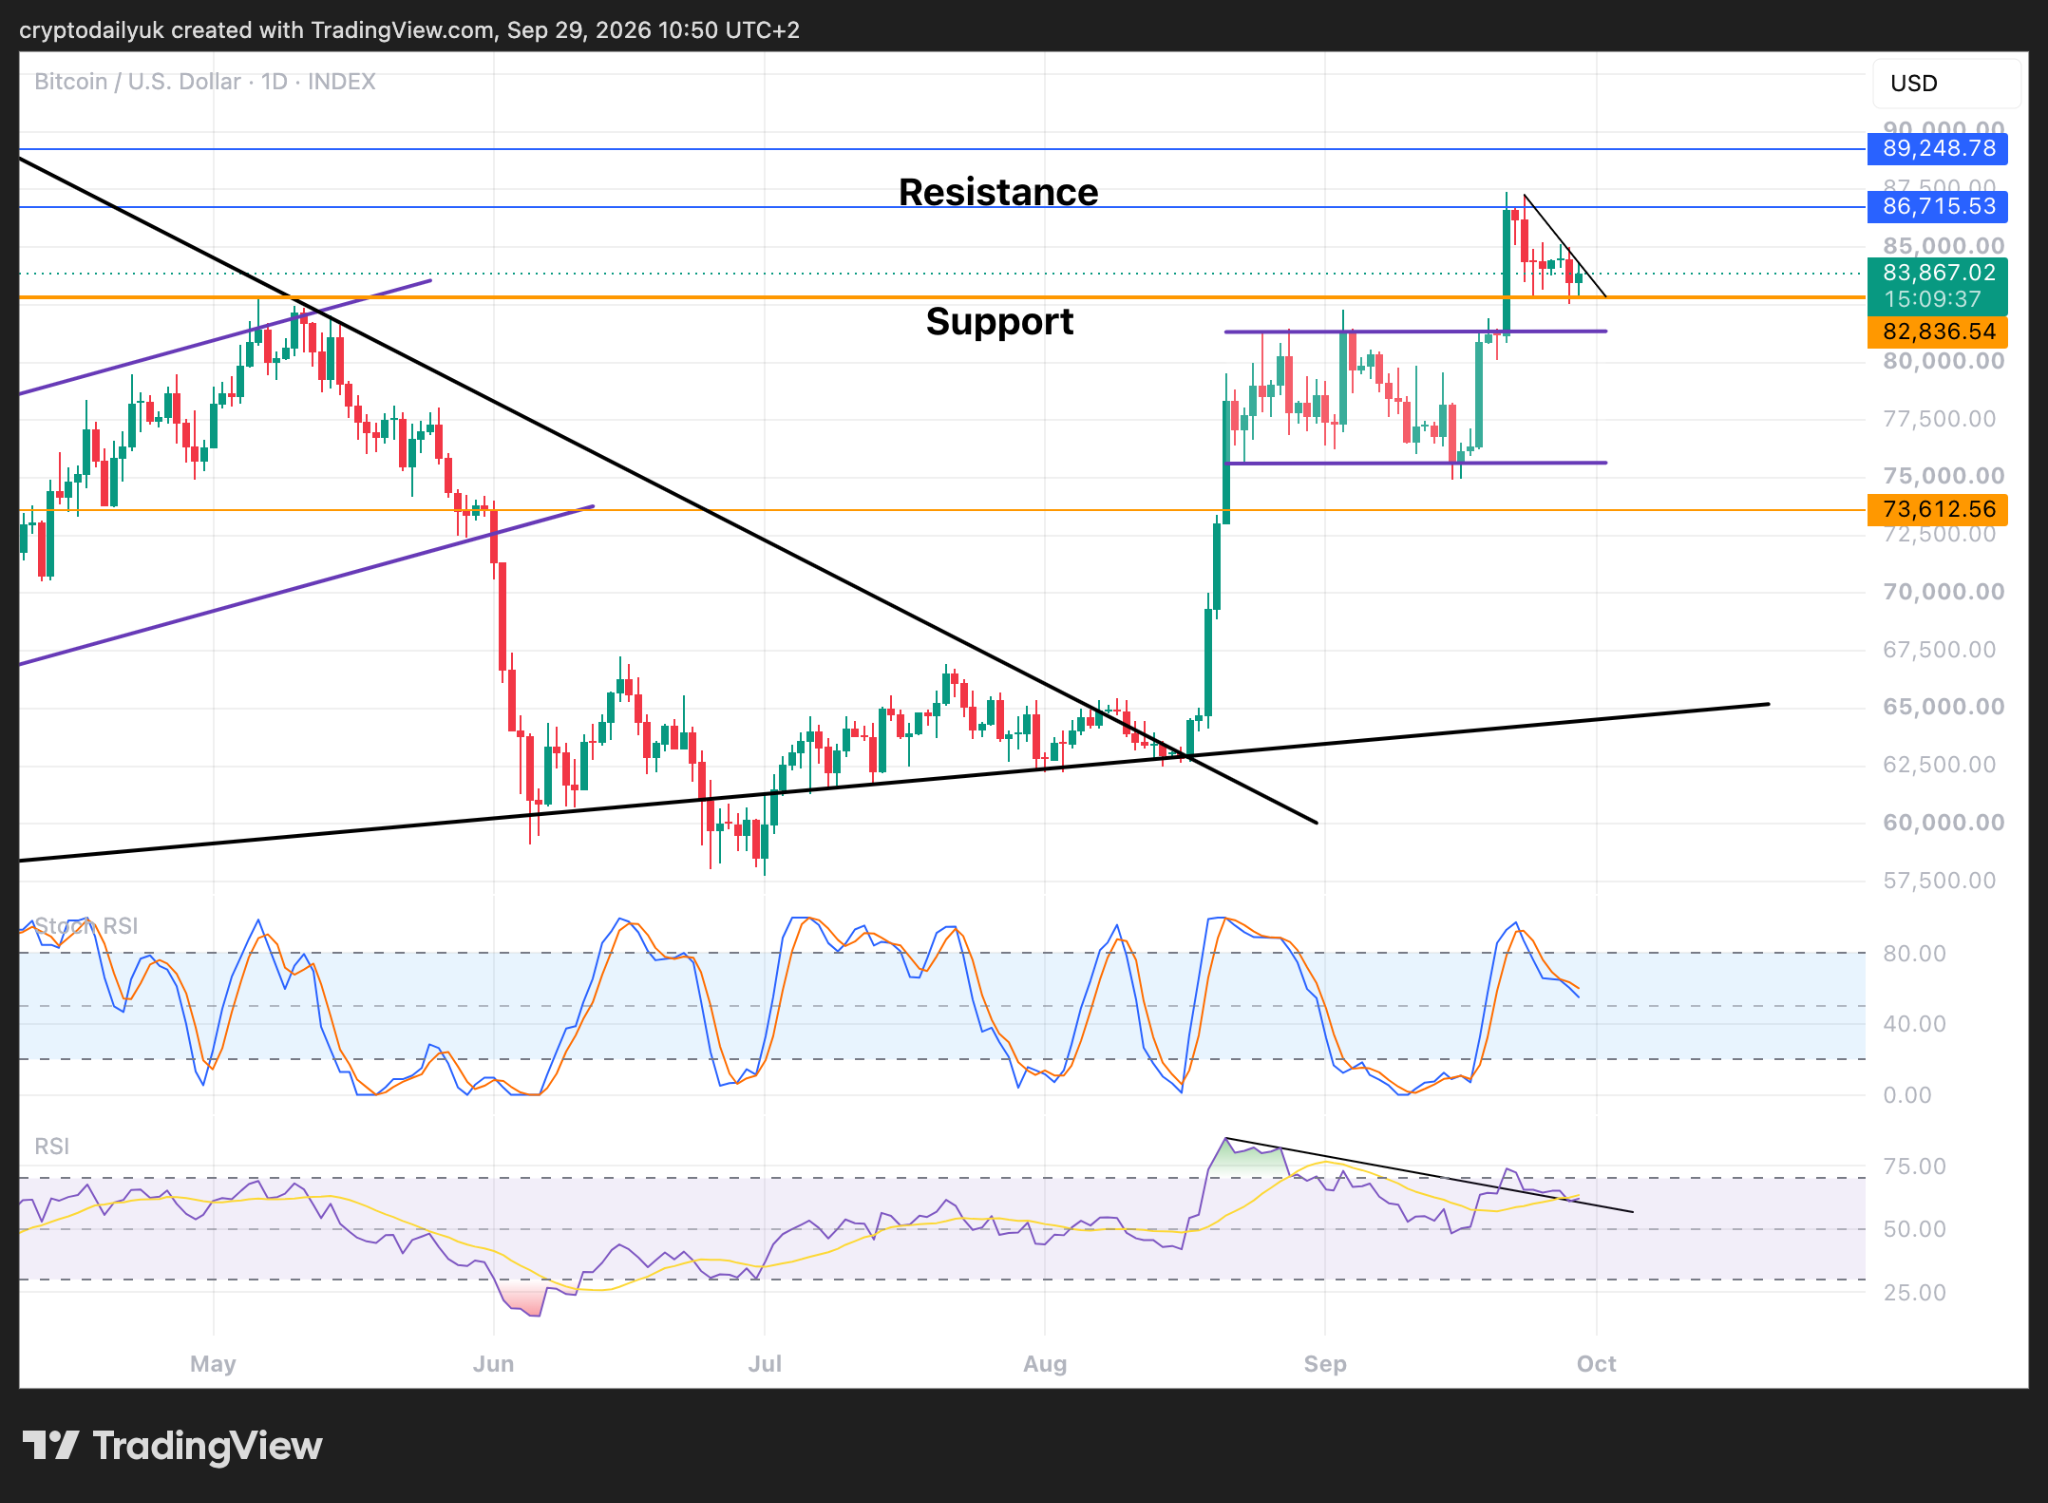
In the daily time frame the triangle pattern looks more apt than another parallel channel, given the lack of touch points for the top of the channel. Therefore, the $BTC price is very close to the next decision point of a collapse through the strong support, or a breakout that heads back up to $86,700.
The Stochastic RSI indicators still have a way to go to come back down and fully reset. This is while all the lower time frame indicators are on their way back up.
The RSI is probably the best indicator here. As can be seen, the indicator line is holding above a descending trendline. If this trendline gives way, this could be the signal that price action is also going to fall.
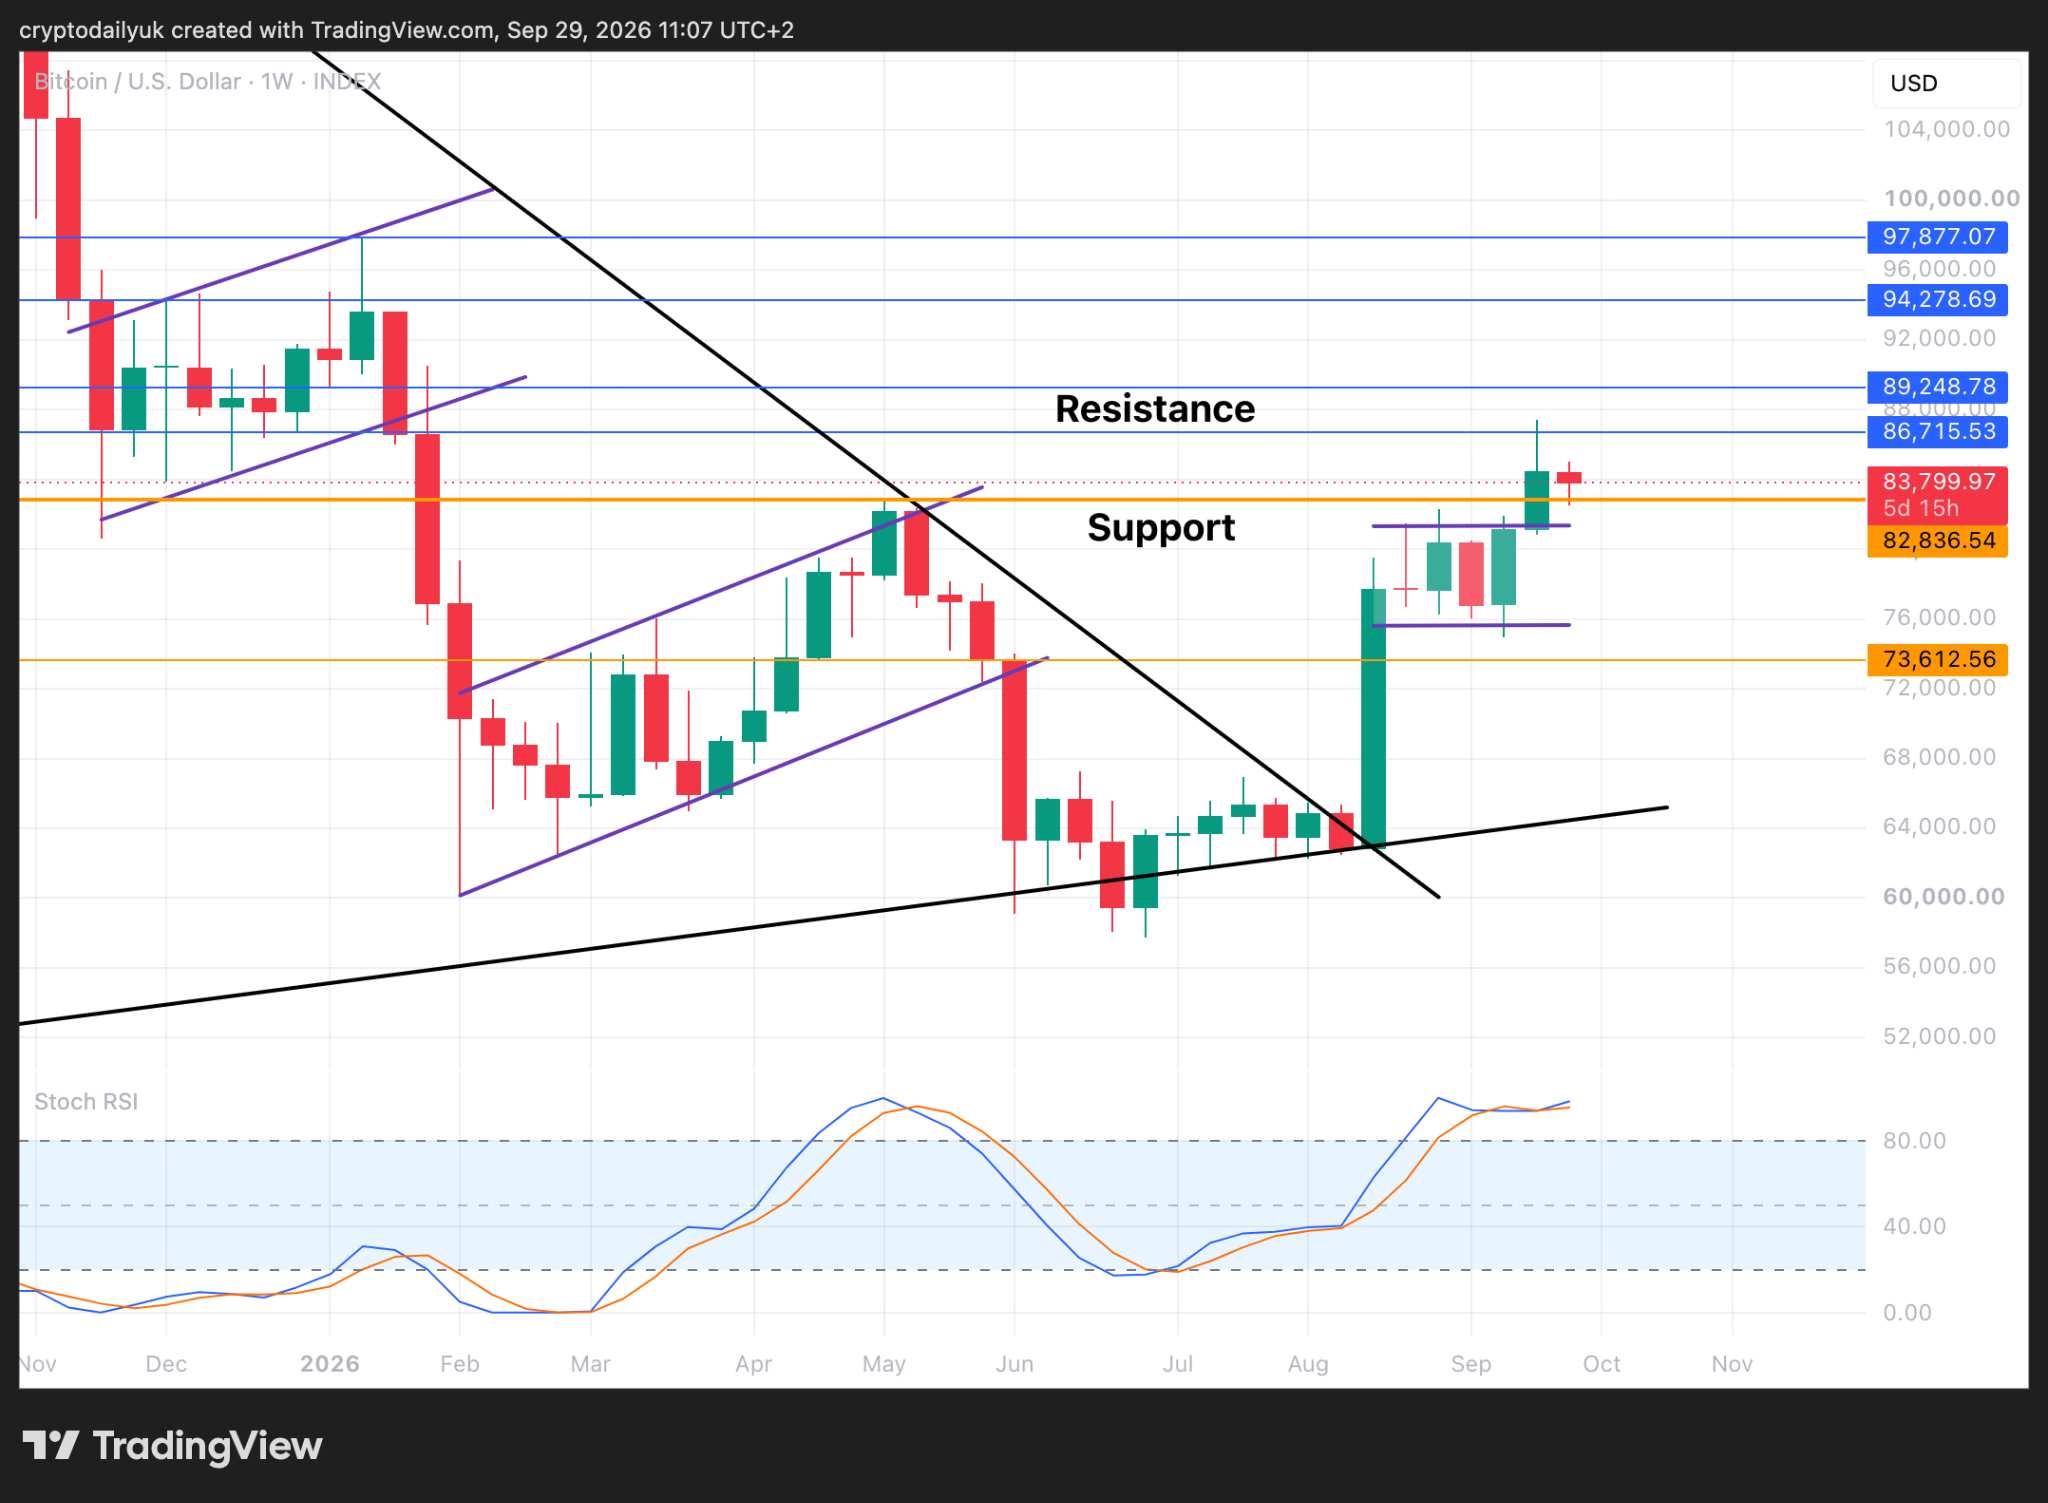
$BTC tests $83K as new support
Source: TradingView
The weekly chart shows that the current weekly candle has come back down to test and confirm the previous resistance, which will be new support as long as the $BTC price holds above by the end of the week.
The question to be answered now is will bond yields come back down? If they don’t, this could be a difficult environment for risk assets to rise into.
It will be interesting to see how Bitcoin copes with this particular wall of worry.
Disclaimer: This article is provided for informational purposes only. It is not offered or intended to be used as legal, tax, investment, financial, or other advice.






Be the first to comment