


What to know:
- Bitcoin enters historically slow summer months as traders debate whether the recent recovery can continue.
- Liquidation data still shows heavy long positioning, with downside liquidity remaining a major risk.
- The $93K–$95K resistance zone remains the key level that could decide Bitcoin’s next macro trend.

Bitcoin has spent the past several weeks showing steady strength, but market participants remain divided over whether this recovery can continue or if another major decline still lies ahead for the Bitcoin liquidation levels set up in the BTC market.
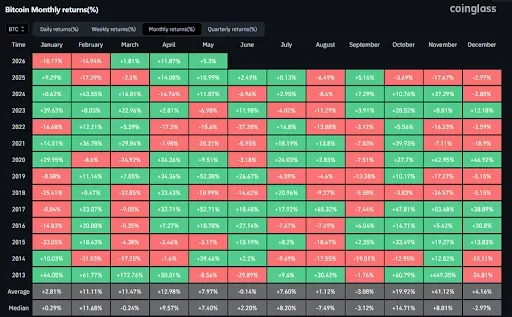
Daan Crypto Trades, a Bitcoin trader, stated that Bitcoin tends to be slow in summer due to low volatility and short-term trading narratives.
He does not anticipate any significant breakout or crash in 2026. Rather than engaging in active trading, he prefers to accumulate Bitcoin.


Source: X
This is an indication of his prudence with regard to changes in the Bitcoin liquidation levels. He had invested in Bitcoin in the range of $60,000-$70,000 but has stopped purchasing more Bitcoin until he gets the right opportunity.
Also Read: IOTA Price Analysis: Bullish FVG Retest Signals Breakout Toward $0.0671
Bitcoin Liquidation Levels And Risk Keep Traders Cautious
On the other hand, the trader ctm_trader tried to oppose all those views concerning the fact that the market is going bearish overall.
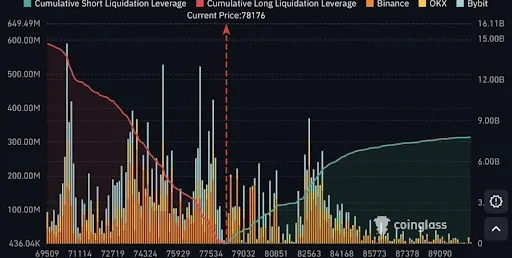
In support of his views, he referred to the Bitcoin liquidation levels, which reveal that many traders are long even after the BTC price’s recent volatility.
With respect to his calculations, a reduction of 12% from the current level will lead to the Bitcoin liquidation levels of roughly $14.6 billion worth of longs, whereas a similar rise in prices would mean the loss of $7.8 billion worth of shorts.

Source: X
This means that the bull’s leverage advantage prevails in the current crypto market. Bitcoin’s technical outlook for the long run remains unfavorable as well.
The cryptocurrency has yet to see either a new high or a new low since the peak observed in October 2025. As a result, due to the difference in Bitcoin liquidation levels, it can return to more illiquid levels once again.
Bitcoin Recovery Structure Builds Near Key Support
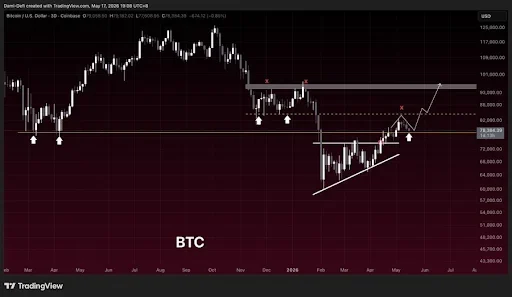
Another market analyst had a more optimistic outlook, stating that the current decline in Bitcoin’s prices was expected after BTC gained roughly 35%, from $61,000 to $82,800.
The analyst noted that the region around $78,000 on the three-day timeframe could be viewed as an essential support level, which has been consistently acting as a benchmark since early 2025.

Source: X
So long as Bitcoin remains above this level, the outlook for a recovery will remain intact. From the chart, it appears that Bitcoin is currently moving above the previous price drop, which took Bitcoin from a high of above $90K to around $58K-$60K.
Higher lows and an ascending trend line now indicate growing confidence among the buyers. However, there is significant resistance at $93K-$95K levels.
This article contains market analysis and price predictions. These are not guarantees. Crypto markets are volatile. Always DYOR. Not financial advice.
Also Read: TRX Price Surges as Institutional Buying Grows: Is $0.47 the Next Target?

Be the first to comment