


What to know:
- Bitcoin MVRV at 1.26 signals a key transition zone historically linked with market cycle shifts.
- Long-term holders show about 26% unrealized gains, suggesting steady accumulation despite volatility.
- Indicators remain mixed as MACD stays negative while price action attempts recovery from lows.

Bitcoin MVRV indicates that we are now in a critical transitioning period when long-term holders find themselves close to reaching an area that was typically seen when there were significant changes in the market. Additionally, the BTC price seems to be stabilizing after its sharp pullback.
At the time of writing, BTC is trading at $64,163. The asset has a 24-hour trading volume of $41.85 billion and a market value of $1.28 trillion, while gaining 3.36% over the last 24 hours. The current Bitcoin MVRV reading is being closely watched as it sits in a historically important zone.


Source: CoinMarketCap

Also Read | Stellar (XLM) Shows Early Reversal Signs While Long-Term Targets Reach $5
Bitcoin MVRV Marks Key Zone
According to a report from the analysis firm Alphractal, the Long-Term Holder Market Value to Realized Value (MVRV) ratio for Bitcoin stands at 1.26. The metric is the ratio of the current market price of the coins held by long-term hodlers against the average purchase price.
The Bitcoin MVRV of 1.26 is in the range of what has been witnessed before during cycle shifts. The low of 1.0 has been observed at the bottom of cycles in 2015 and 2018-2019, while the Bitcoin MVRV in 2022, after FTX, was around 1.1. Unlike the above cycles, the Bitcoin MVRV is indicative of a market at a more compressed stage.


Source: Alphractal’s X Post
During the previous rounds, the moment Bitcoin MVRV approached the vicinity of 1.3 usually took place over a period of weeks or months until any signs of reversal emerged. This is to show that changes do not occur immediately but take much longer than anticipated.
In its current state, the value of MVRV Bitcoin implies that the unrealized gains for the long-term holders amount to an estimated 26%. While this figure is not as high as compared to bullish market conditions, it is above the level where they make no gain at all.
Two insights arise from this. One is that the present Bitcoin MVRV ratio indicates accumulation since long-term hodlers have remained consistent despite fluctuations in prices. The second is that this ratio could remain compressed for some time to come because it has no bottom.
Price Action and Market Behavior
With Bitcoin currently trading under the middle Bollinger Band level of $71,032, there is evidence of increased selling pressure previously. The cryptocurrency had moved closer to the lower Bollinger Band of $59,166 before moving up towards $63,800.
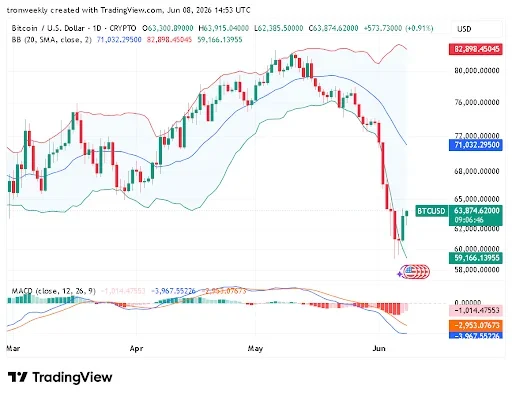

Source: TradingView
Bearish trend continues for the MACD as the MACD line stands lower than the signal line by -3,967.55 against -2,953.08, indicating a negative MACD histogram value of -1,014.48. Momentum is still moving towards the downside, although buying pressure has improved slightly.
Overall, the Bitcoin MVRV ratio combined with price action indicates that there is a stabilizing market. What comes next will be determined by whether there is enough demand for the asset to move forward.
This article contains market analysis and price predictions. These are not guarantees. Crypto markets are volatile. Always DYOR. Not financial advice.
Also Read | XRP Price Rebounds Above $1 as Market Eyes Potential $10–$20 Move

Be the first to comment