


What to know:
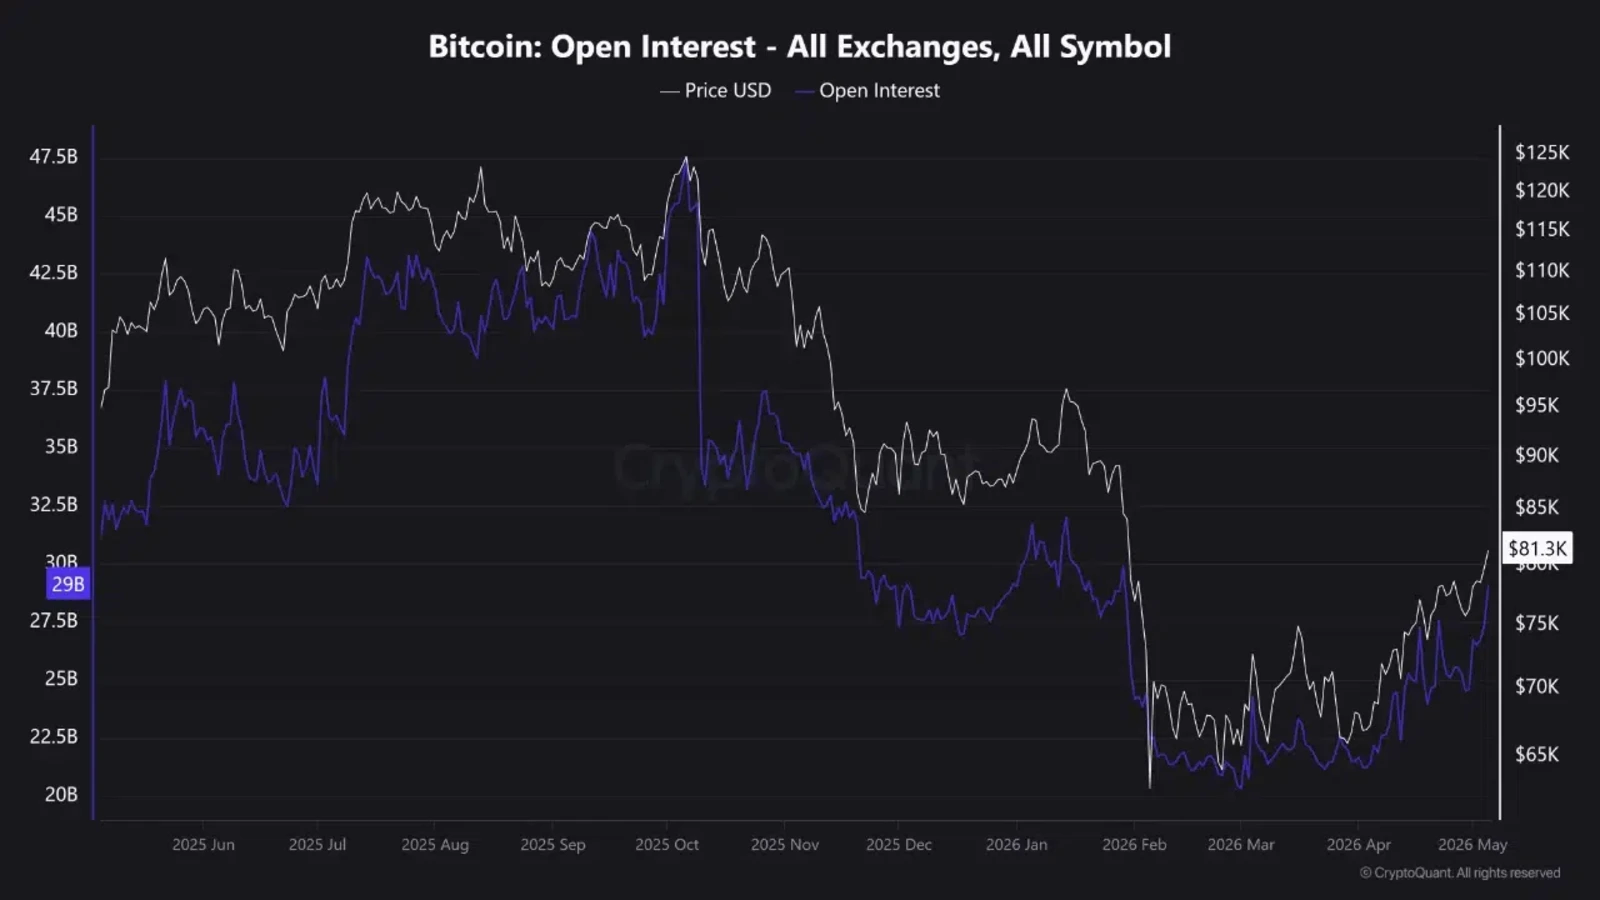
- Surging open interest sparks leverage-driven volatility concerns.
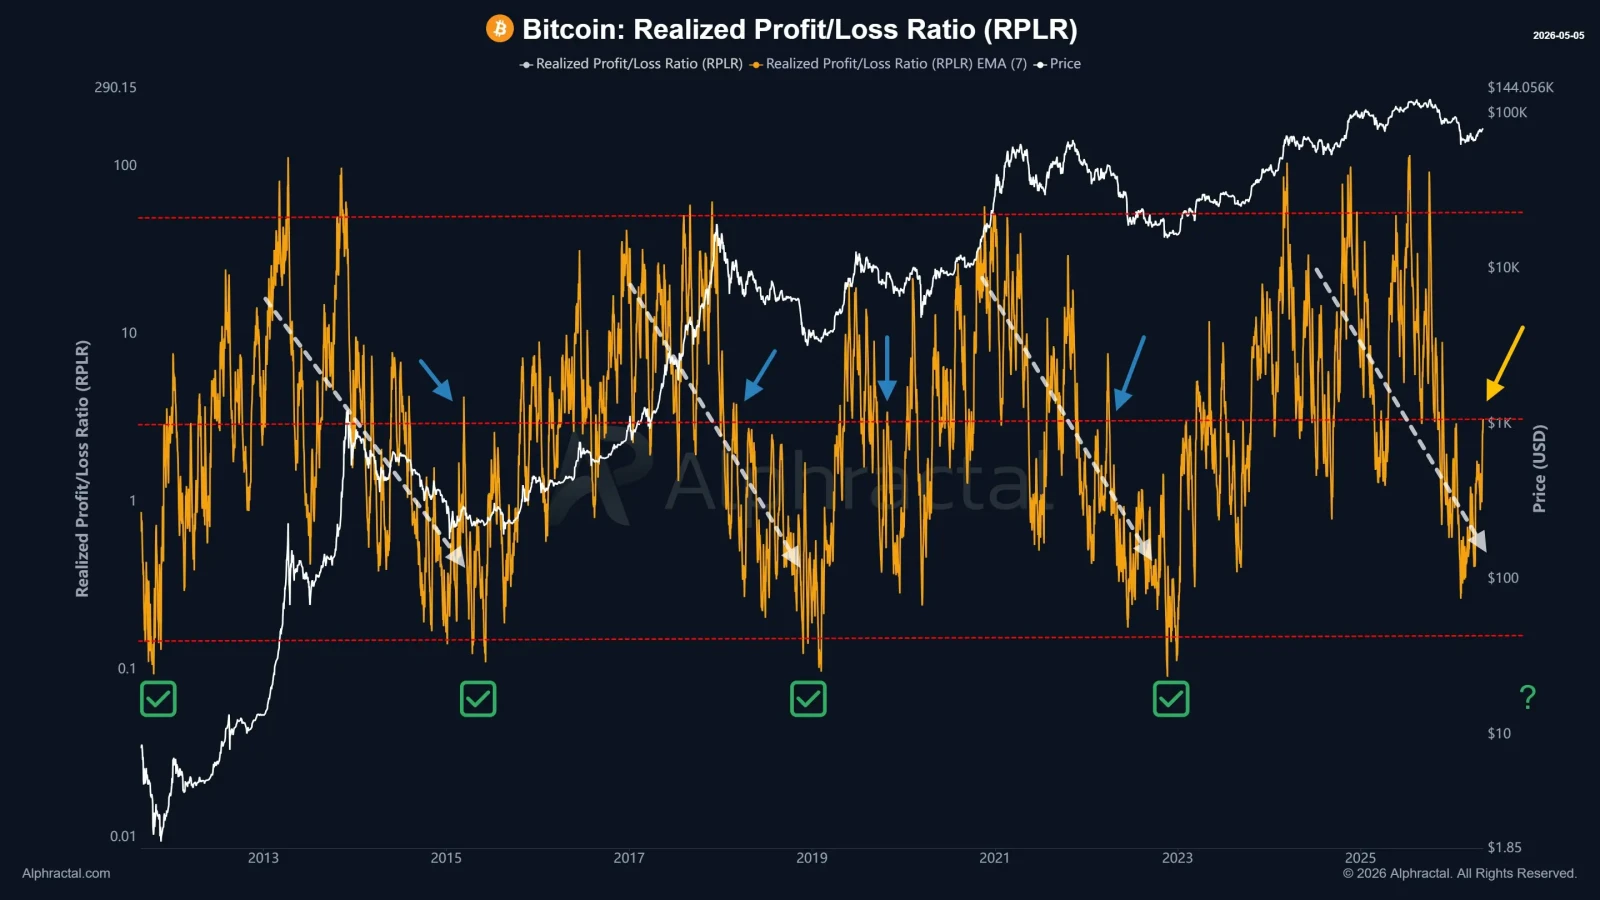
- Realized Profit/Loss Ratio climbs, echoing pre-peak patterns.
- BTC price tests key $81,656 resistance with mixed on-chain signals.

Bitcoin price analysis shows BTC trading near $81,399 on May 5, according to CoinMarketCap data. This Bitcoin price analysis highlights rising volatility risk as Bitcoin on-chain data and derivatives signals diverge.
According to CryptoQuant analyst CoinNiel, exchange outflows remained negative but weakened significantly. At the same time, open interest surged, increasing leverage-driven market risk.
Funding rates remain negative, illustrating that the futures market does not seem too bullish. But the Bitcoin price analysis also states that increasing leverage means increasing risks of volatility.

Bitcoin On-Chain Data Show Profit/Loss Ratio Behavior
According to analyst Joao Wedson, historical data for the profit/loss ratio has shown that the ratio has often declined before Bitcoin reaches its peak for the cycle. Historically, this has signaled increasing downside risks before large down corrections occur.
Current numbers indicate that the profit/loss ratio has begun to rise again. While some people might view this as positive, this same pattern can be seen during temporary bull runs within broader bear markets.
The profit/loss ratio is not yet at extreme capitulation levels. This implies that the entire market has not yet experienced a full reset from a perspective of cyclical events.
Also Read | Bitcoin (BTC) Crisis: 2 Choices, $88B at Risk
Bitcoin Price Has Reached Major Long-Term Support
On the daily chart from TradingView, the Bitcoin price has been testing the resistance at $81,656 around the 200 EMA. The shorter moving averages (the 50 EMA & 20 EMA) continue trending upwards and represent support for short-term bulls.
The RSI is sitting at 69 and is getting close to being considered overbought. The MACD continues to illustrate bullish continuation. However, it is losing momentum.
The volume has continued to remain steady and has provided no indication of a breakout. Based on the Bitcoin price analysis, if the price breaks or rejects off of this point, it will determine where the price will go next directionally.
Leverage Risks in the Bitcoin Price Prediction
CryptoQuant data shared by CoinNiel reveal that open interest rose 6.09% to $29.05 billion in order to reach a 30-day high. Increasing activity in the derivatives market is reflected by these higher levels of activity.
Short-side pressure is evident because funding rates have remained negative. Thus, it appears that there aren’t conditions of overheating on the long side of the futures market right now.
There is a growth in the amount of leveraged positions throughout the market. Puell multiple is near 0.85, just above its recent average level.
It seems like we’re experiencing neutral recovery conditions instead of extreme market conditions.
Uncertainty Still Surrounds The Bitcoin Price Prediction
This Bitcoin price analysis shows a mix of both positive and negative characteristics for this market. There is not enough evidence to clearly identify where this coin price will go next.
Based upon this analysis, it would appear that further confirmation is necessary prior to entering into any position. If the price moves sustainably above the 200 EMA, then it may provide additional evidence for the bulls.
Conversely, failure at resistance could lead to continued consolidation or put downward pressure on prices.
Also Read | Bitcoin (BTC) Whales Move $1B as Huge Bull Run Ignites

Be the first to comment