



Bitcoin price slipped below $76,000 before recovering toward $76,900, with weak momentum and dense liquidation zones leaving the price vulnerable ahead of the CLARITY Act vote and Federal Reserve decision.
Summary
- Bitcoin price fell as low as $75,605 before recovering toward $76,900.
- The daily Supertrend remains bullish while 4-hour momentum lacks a clear direction.
- Liquidation clusters sit near $75,000 below and between $77,600 and $78,500 above.
- Analysts view $75,500–$76,000 as the key zone separating a rebound from a deeper fall.
Bitcoin price rebounds after falling below $76,000
According to data from crypto.news, Bitcoin (BTC) price traded near $76,863 at the time of writing after dropping 1.7% during the session. The cryptocurrency opened at $78,189, reached an intraday high of $78,250 and briefly fell to $75,605 before buyers pushed it back above $76,000.

The decline extended Bitcoin’s retreat from the $79,000–$80,000 region, where several recovery attempts have stalled since late August. Price action has since formed lower highs, showing that sellers remain active during rebounds.
Political uncertainty surrounding the Digital Asset Market Clarity Act contributed to the cautious mood. The U.S. Senate was preparing for a procedural vote requiring 60 votes to advance the legislation, while reports of disagreement between Democrats and Republicans reduced confidence in a deal.
Traders were also waiting for the Federal Reserve’s policy decision. The supplied market context showed that changing rate expectations, rising Treasury yields and elevated oil prices had reduced demand for risk assets, including cryptocurrencies.
Daily trend holds, but momentum sends a mixed signal
Bitcoin remains above the daily Supertrend level at $72,786, keeping the broader signal in bullish territory despite the latest decline. The indicator provides a wide cushion below the current market price, but it would offer little support if BTC loses the nearer $75,500–$76,000 demand area.
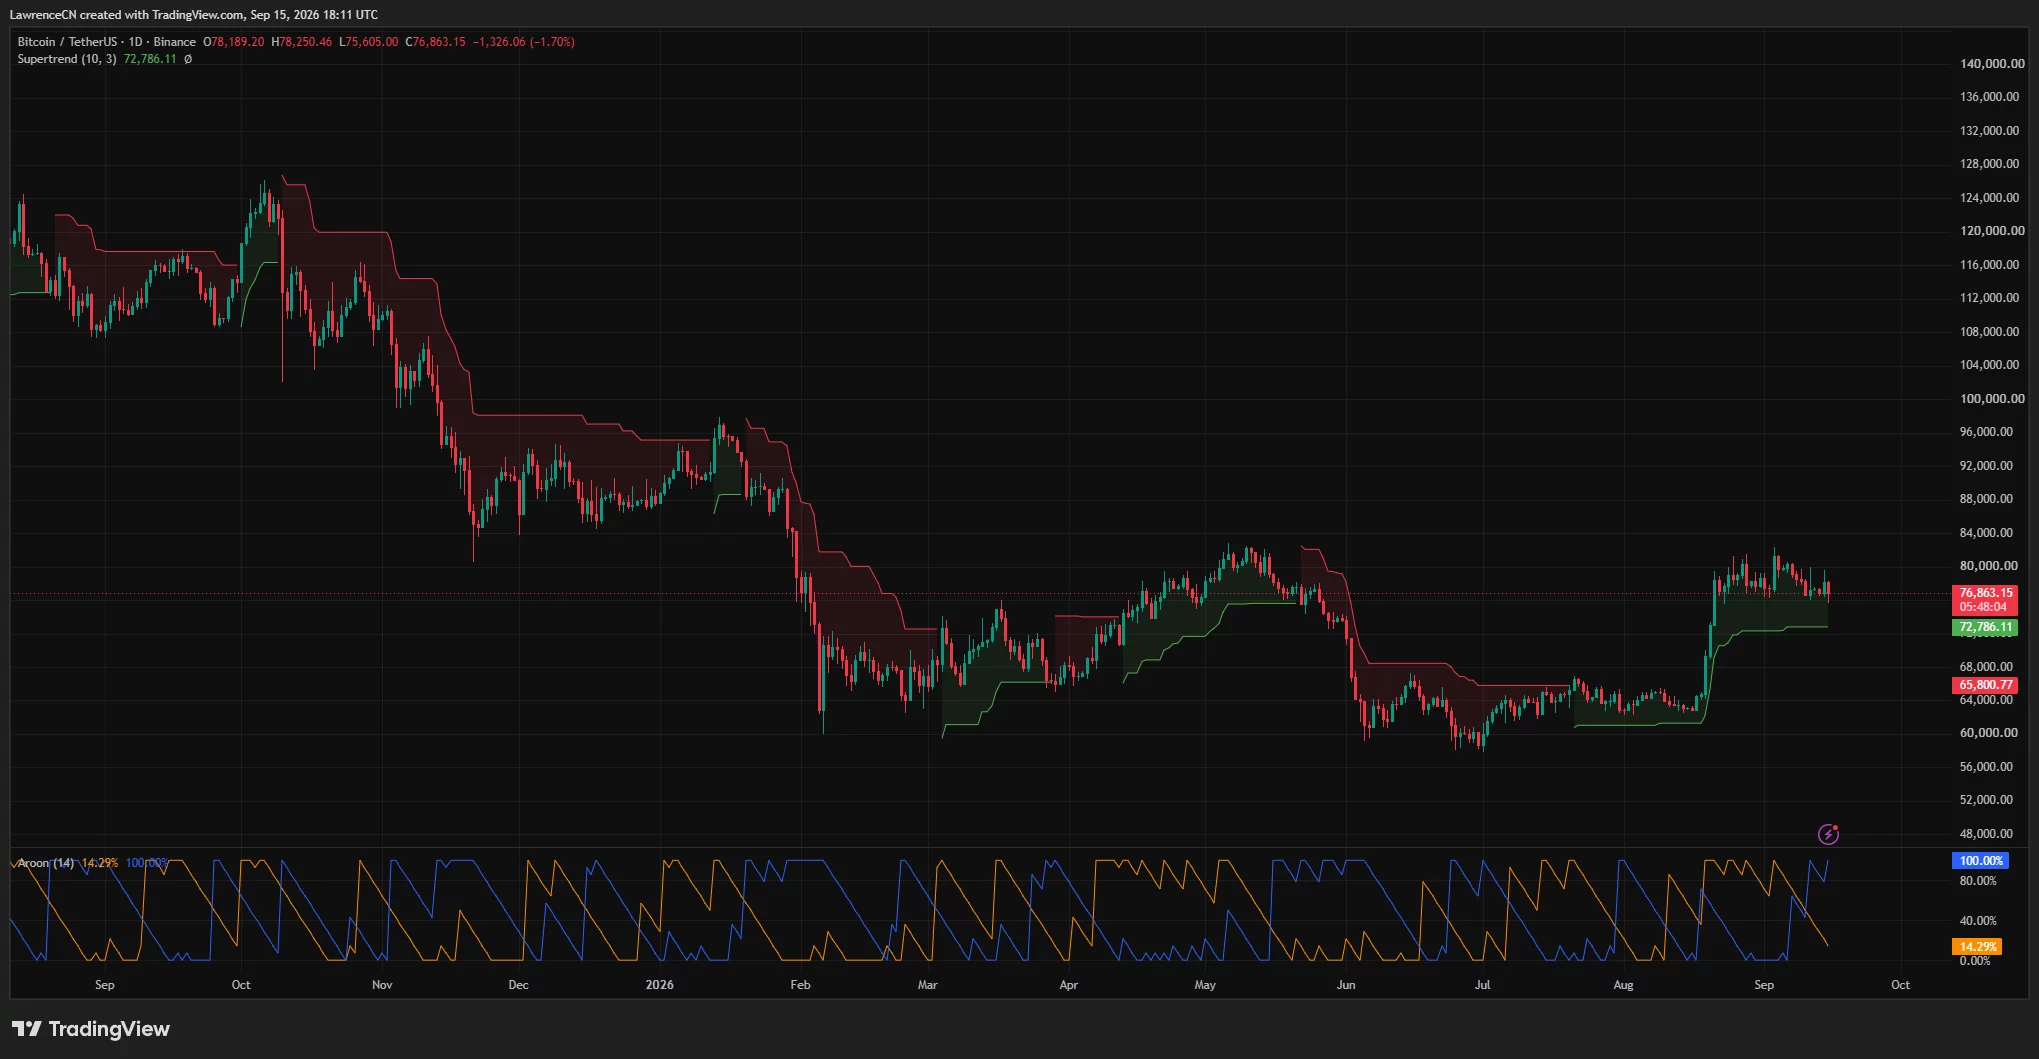
A sustained daily close below that zone would place the August breakout structure under pressure. The next visible support areas sit near $74,000 and the Supertrend level around $72,800.
The daily Aroon indicator presents a mixed reading. Aroon Up stands at 100%, showing that a recent high remains influential within the indicator’s lookback period. Aroon Down, however, has risen to 14.29% as the price moves closer to the lower end of its recent range.
The difference suggests that the wider trend has not fully reversed, although short-term weakness is building. Bitcoin must recover the $78,000–$80,000 area to restore a clearer upside structure.
A close above $80,000 would expose the recent highs near $81,000–$82,000. Failure to regain $78,000 would leave rallies vulnerable to renewed selling.
4-hour chart shows weak trend strength
The 4-hour chart confirms a less decisive short-term setup. Bitcoin traded near $76,869, below the Bollinger Bands’ middle line at $77,404 and close to the lower band at $76,180.
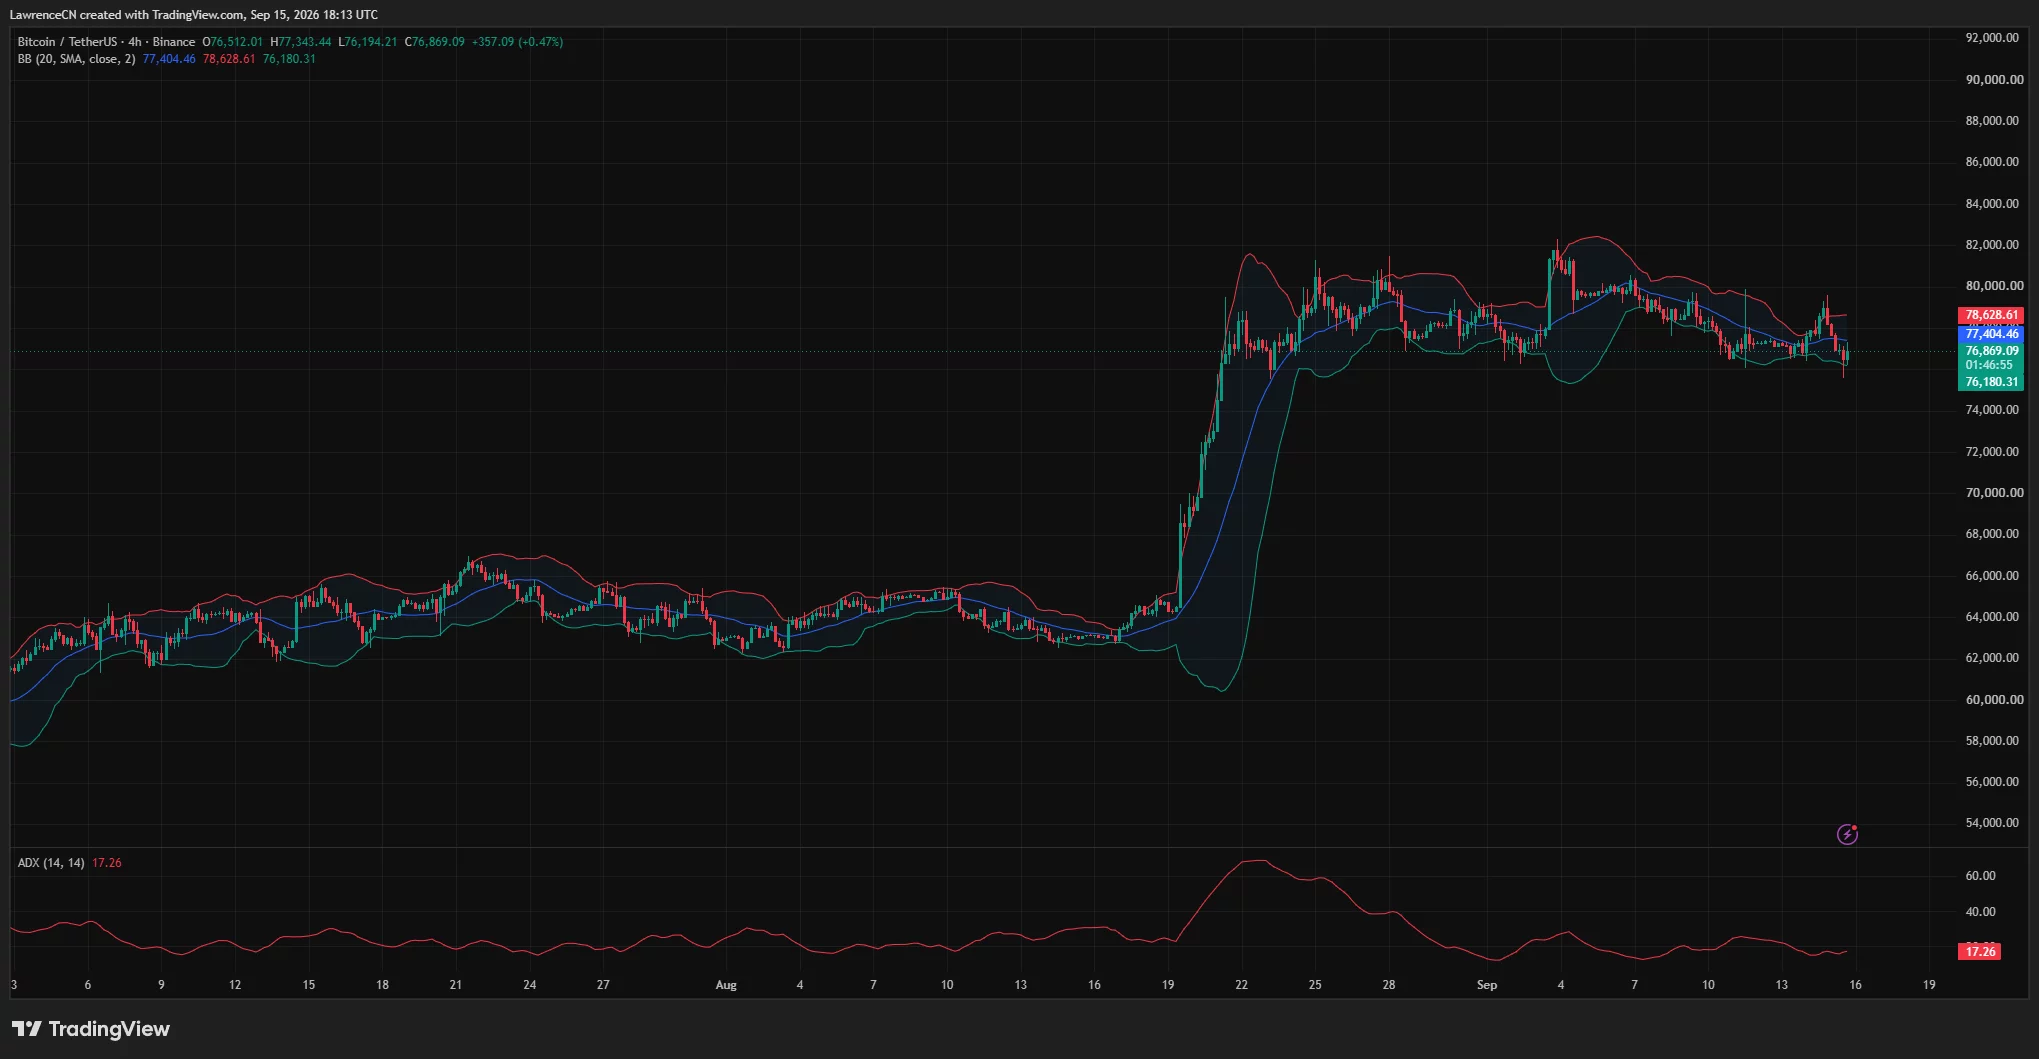
Trading near the lower band reflects persistent selling pressure, although it also leaves room for a short-term rebound if the lower boundary continues to hold. The upper Bollinger Band at $78,629 forms the next major resistance level above the midpoint.
Bitcoin’s 4-hour Average Directional Index stood at 17.26. An ADX reading below 20 typically points to weak trend strength, meaning neither buyers nor sellers have established firm control despite the sharp intraday swings.
The combination of a low ADX and price near the lower Bollinger Band favors continued consolidation unless BTC breaks decisively outside the range. A move above $77,400 would be the first sign of improving momentum, followed by resistance between $78,000 and $78,630.
On the downside, a 4-hour close below $76,180 would increase the risk of another test of $75,500. Losing the intraday low at $75,605 could then open the path toward $74,000.
Liquidation clusters could amplify the next Bitcoin move
The 24-hour CoinGlass liquidation heatmap shows concentrated leverage on both sides of the current price. The strongest nearby liquidity above Bitcoin appears around $77,600–$77,800, with another large cluster extending through approximately $78,200–$78,500.
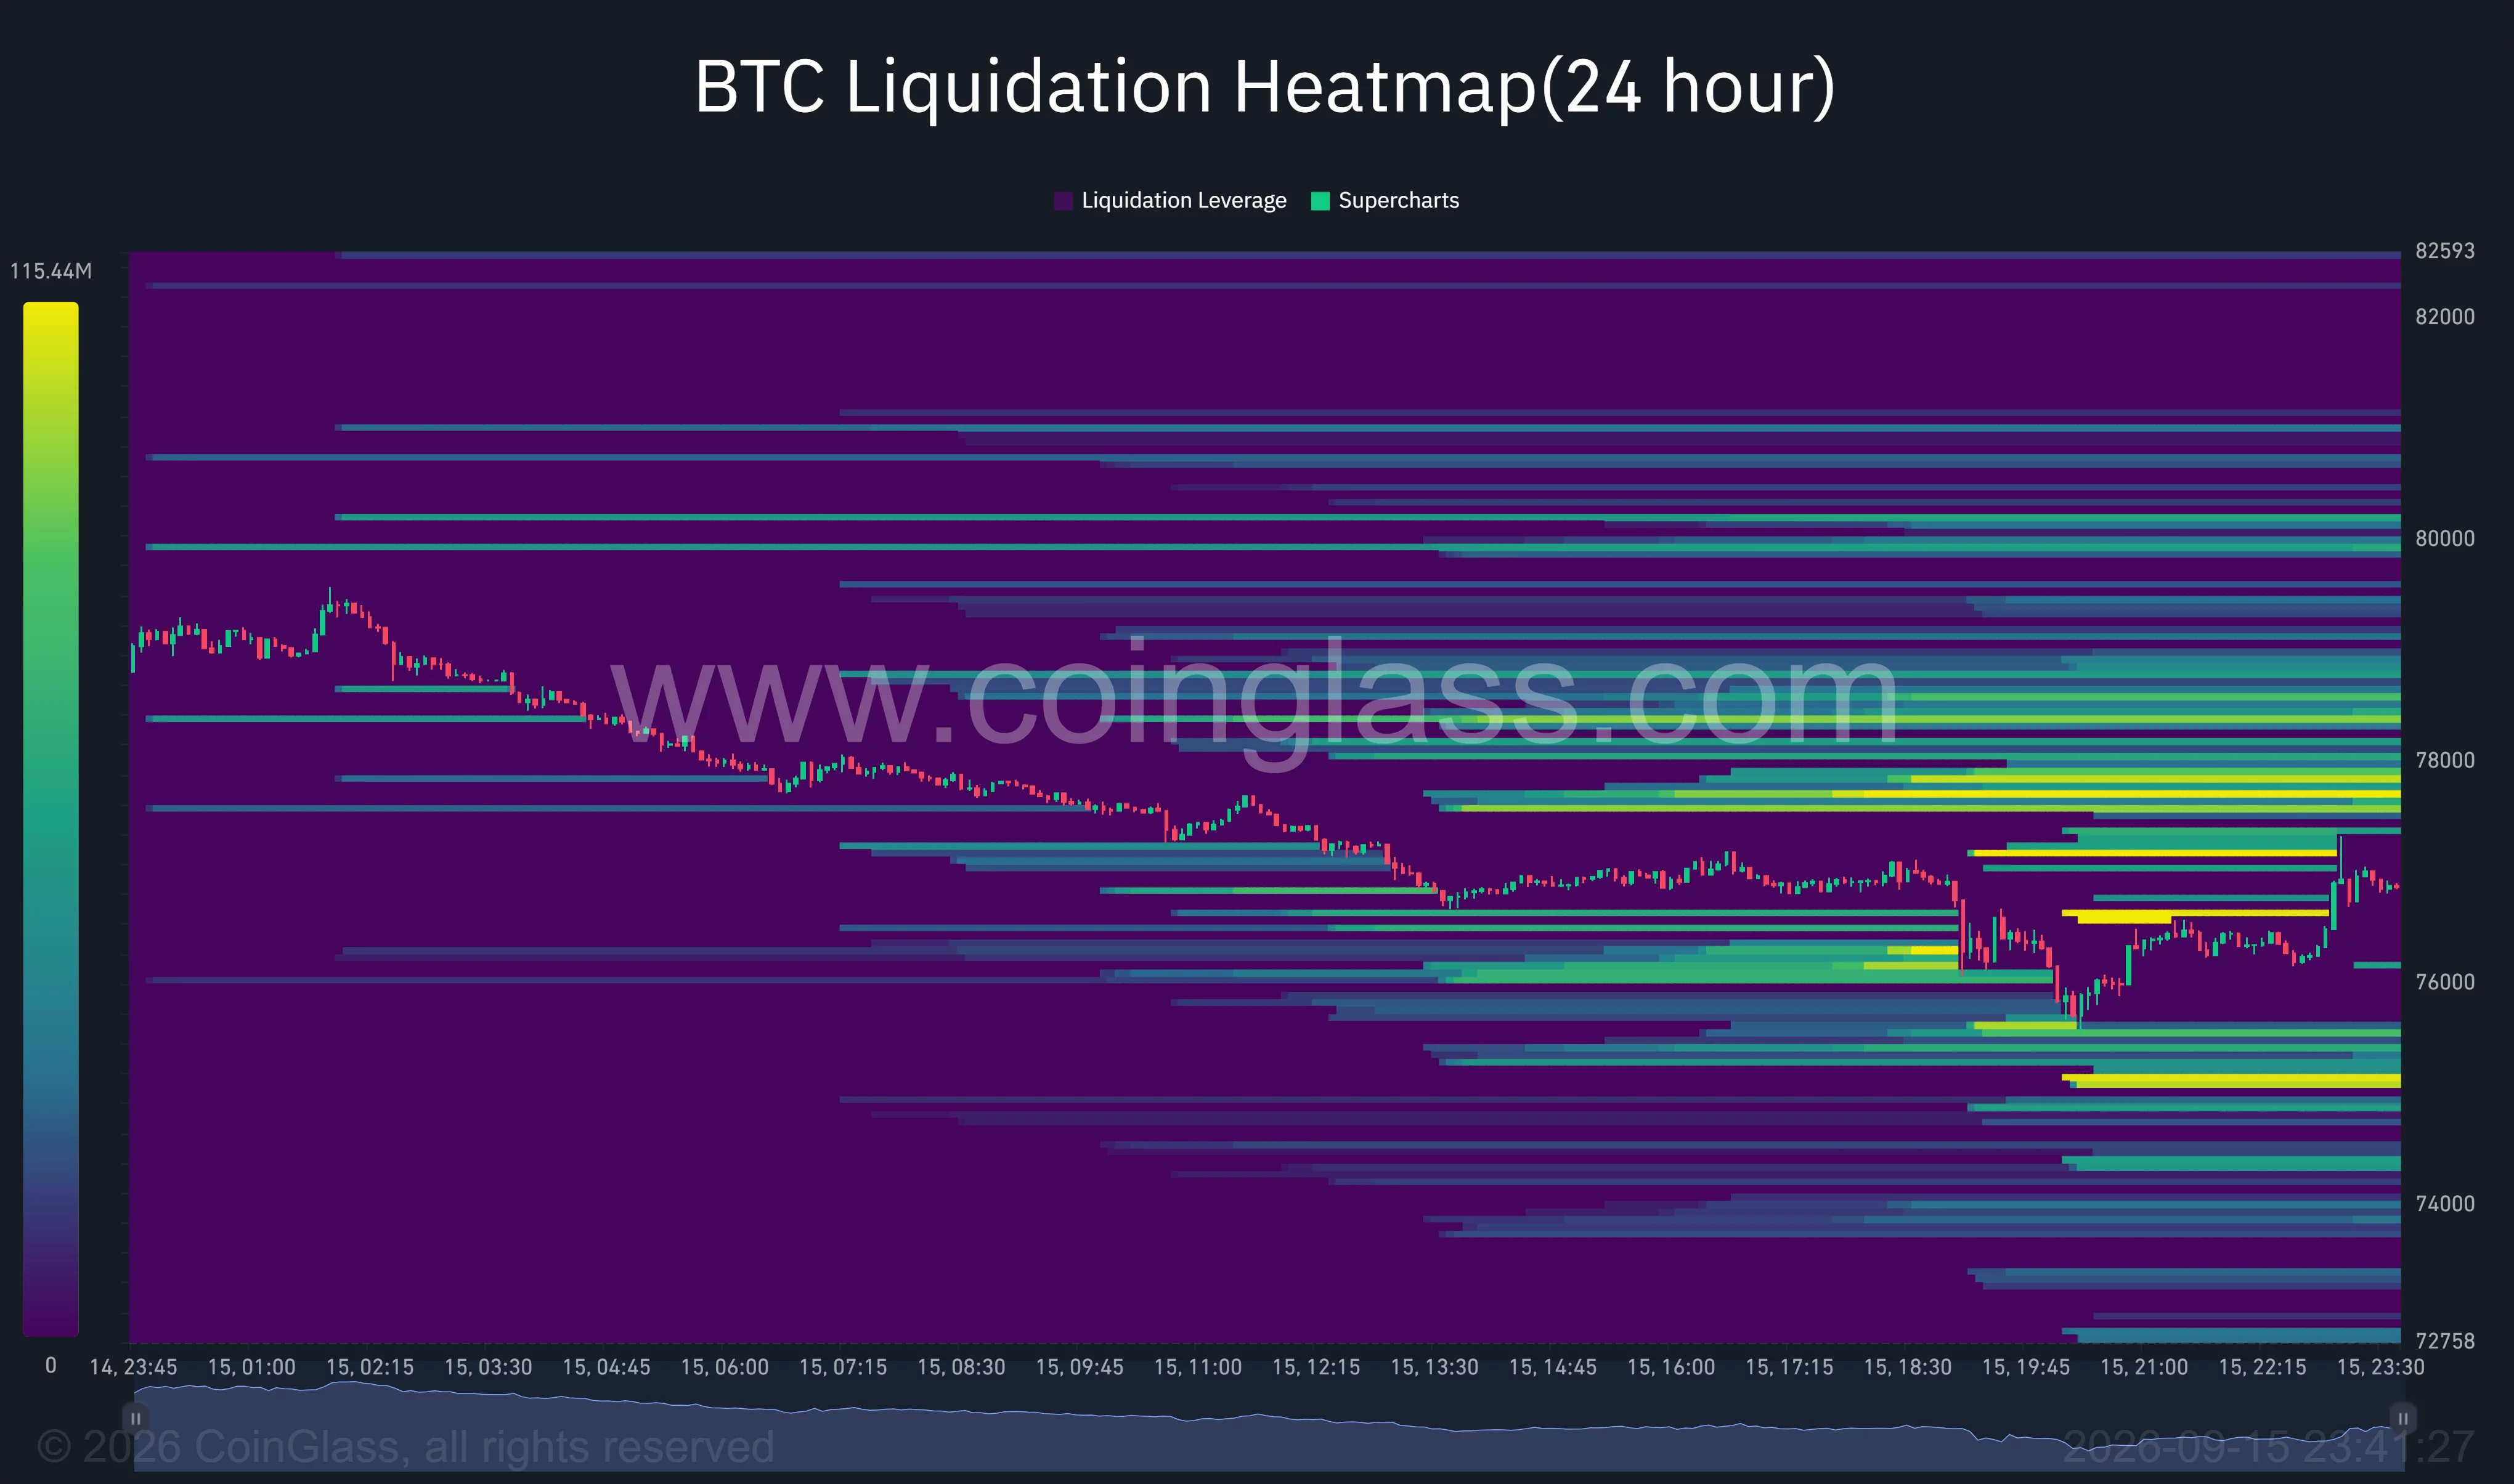
Additional liquidity is visible near $80,000. A rebound through $77,400 could draw the price toward these upper clusters as short positions face pressure.
Below the market, the clearest liquidation concentration sits close to $75,000, followed by smaller pools around $74,000 and $73,000. A break below $75,500 could therefore accelerate the decline as leveraged long positions are closed.
The two-sided concentration fits the weak ADX reading. Bitcoin remains inside a market where nearby leverage could pull the price sharply in either direction once the current range breaks.
Analysts identify $75,500 as Bitcoin’s key support
Pseudonymous trader Altcoin Sherpa called the current area a “do or die level” and said losing it could send Bitcoin toward $72,000. The analyst’s chart placed the main support band around $75,000–$76,000, broadly matching the daily and 4-hour technical levels.
Trader Lennaert Snyder said Bitcoin had swept the previous week’s low near $76,000 and reacted bearishly afterward. His preferred scenario involved a brief move below $75,500 followed by a rebound, rather than an extended breakdown.
Snyder’s chart mapped a wider demand zone around $75,000–$76,000 and identified overhead resistance near $78,000, $79,500, and $80,500. He tied the next major move to the CLARITY Act vote and the Federal Reserve decision.
The technical evidence leaves Bitcoin at a decision point. Holding $75,500–$76,000 could support a recovery toward $77,400 and $78,600, while a confirmed breakdown would bring $74,000 and the daily Supertrend near $72,800 into view.
Disclosure: This article does not represent investment advice. The content and materials featured on this page are for educational purposes only.



Be the first to comment