


Bitcoin price has retreated after failing to hold above $65,000 despite softer U.S. inflation data, leaving traders split over whether the latest pullback is a pause before another breakout or the start of a deeper correction.
Summary
- Bitcoin price failed to hold above $65K as whale selling and profit-taking capped the CPI-driven rally.
- Long liquidations and dense leverage clusters have shifted focus toward the $63K-$63.8K support zone.
- Analysts say a daily close above $65K is needed to revive bullish momentum and target higher levels.
According to data from crypto.news, Bitcoin (BTC) price climbed to nearly $65,470 after lower-than-expected U.S. CPI and PPI reports strengthened expectations that the Federal Reserve could avoid further policy tightening in the short term.

The rally lost momentum almost immediately as sellers emerged around a major resistance zone, pushing Bitcoin back toward $64,000. Market sentiment has turned cautious as traders weigh improving inflation data against renewed macro and on-chain headwinds.
Glassnode data shows long-term holders used the rally to reduce exposure, with investors who accumulated near last year’s highs selling into strength instead of waiting for higher prices. At the same time, short-term traders and whales locked in profits near resistance, limiting follow-through buying after the inflation-driven move. Spot Bitcoin ETF demand also slowed after several sessions of strong inflows, leaving thinner liquidity during the rejection.
A rapid unwind in derivatives added to the decline. Funding rates had risen across major offshore exchanges as leveraged long positions accumulated before the CPI release. Once Bitcoin slipped below the $64,400 area, automated liquidations accelerated selling pressure and pushed the price toward an intraday low near $63,900.
CoinGlass liquidation data continues to show dense leverage clusters above the market around $65,000-$65,500 and another concentration below $63,000, raising the likelihood of sharp volatility in either direction.
Bitcoin price still holds an uptrend while $63K remains intact
The 4-hour chart shows Bitcoin maintaining an ascending trendline that has supported every major pullback since early July. BTC price briefly broke below the trendline before reclaiming it, but the latest rejection has returned it to that support area around $63,800-$64,000.
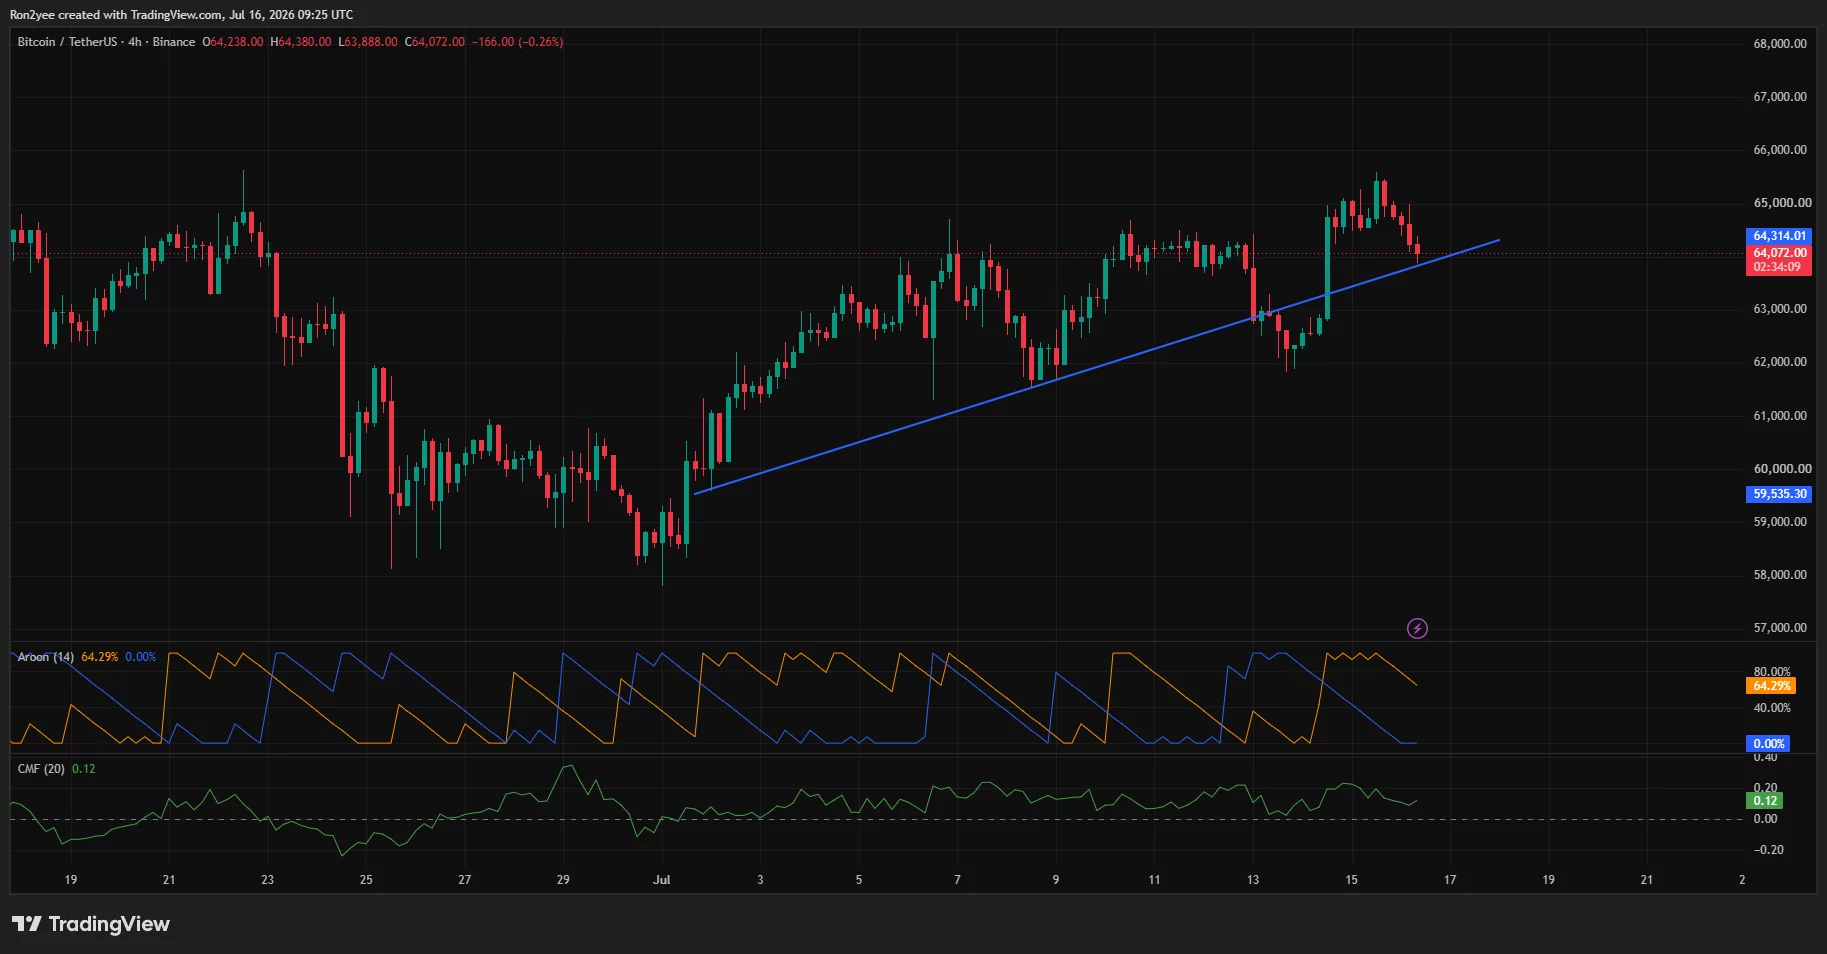
Aroon Up remains above 64 while Aroon Down sits near zero, suggesting buyers still control the intermediate trend despite the recent setback. Chaikin Money Flow also remains positive at 0.12, showing capital has not exited the market aggressively.
The daily chart presents a more balanced picture. Bitcoin has struggled to reclaim the 78.6% Fibonacci retracement level near $63,205 on a sustained basis while facing repeated rejection below $65,500.
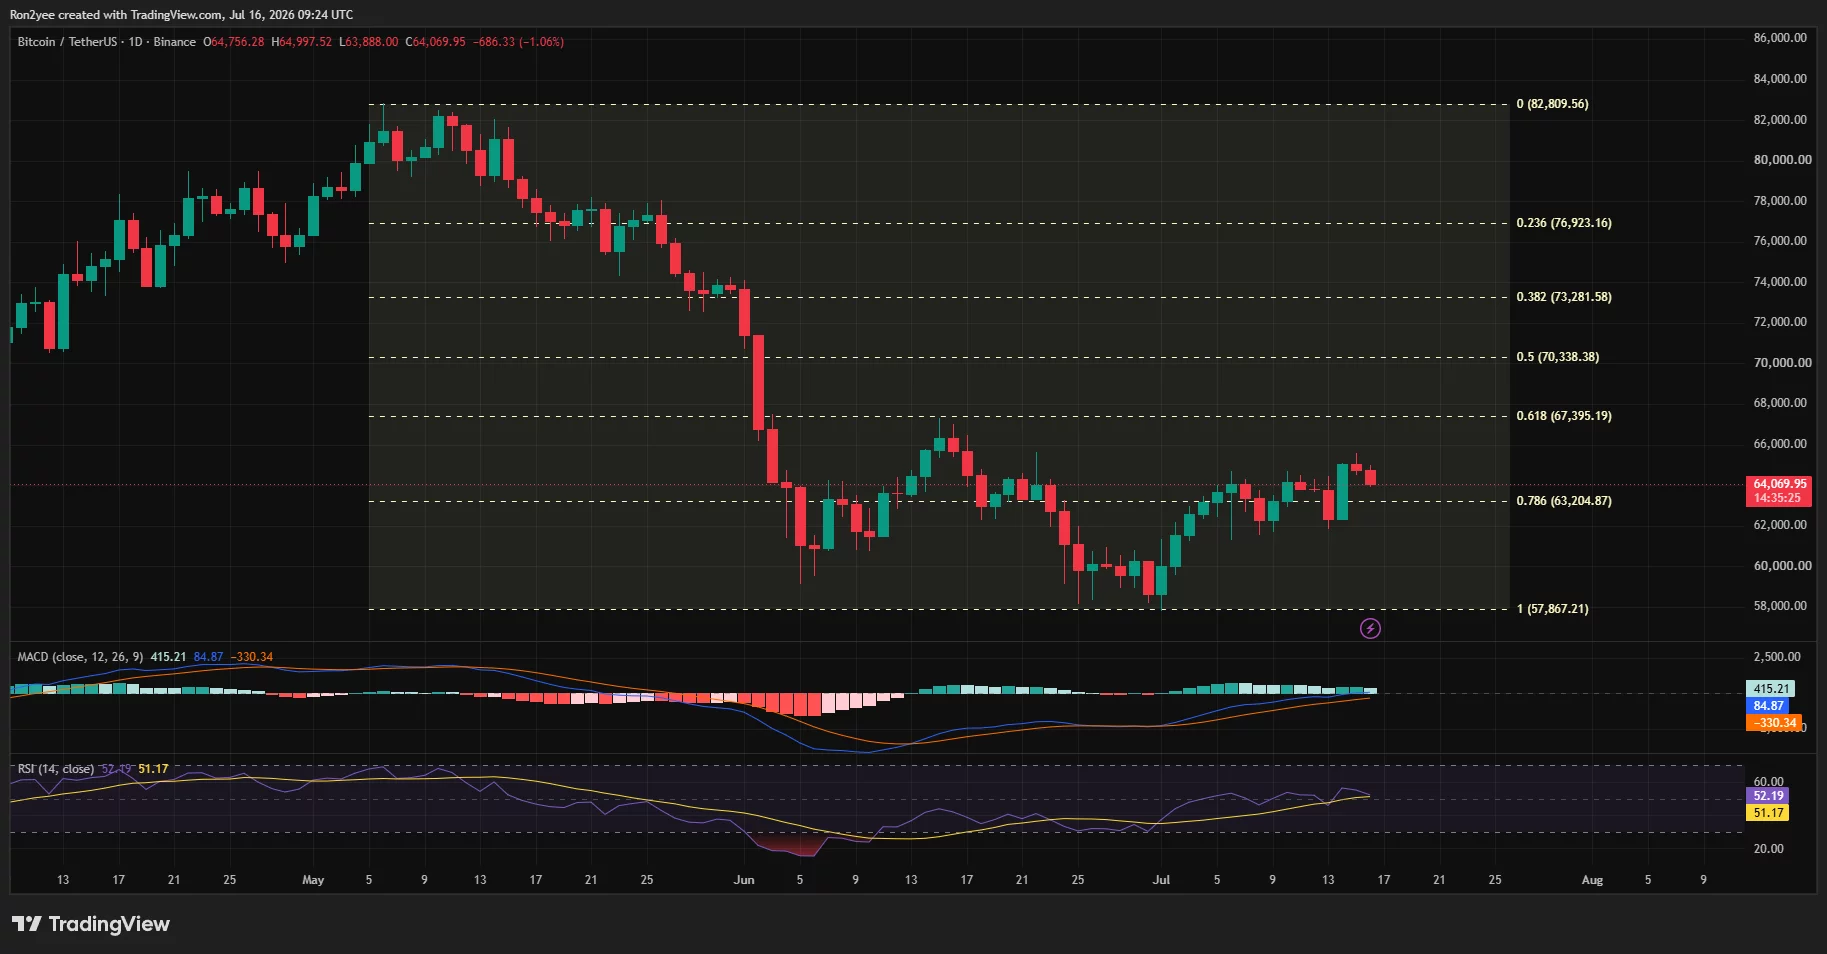
The MACD remains above its signal line, but the histogram has started to flatten, showing upside momentum has slowed. Meanwhile, the RSI hovers around 52, leaving room for another move in either direction without entering overbought or oversold territory.
Commenting on the latest move, analyst Ted Pillows argued that Bitcoin needs stronger confirmation before another leg higher.
“A daily close above $65,000 is needed for strong expansion. Or else, Bitcoin will erase all its short-term gains.”
Trader Lennaert Snyder also believes the rejection does not end the bullish case but requires patience. According to Snyder, the failed breakout near $65,600 leaves more liquidity above current prices, although he expects Bitcoin to first defend the $63,800 region before attempting another advance.
Macro risks and liquidation zones could decide the next move
Several macro risks continue to limit bullish conviction despite softer inflation data. Oil prices have recovered after recent geopolitical tensions involving Iran and the Middle East, raising concerns that inflation could remain elevated later this year. A stronger U.S. Dollar Index has also reduced demand for risk assets, while uncertainty surrounding the distribution of more than 140,000 BTC to Mt. Gox creditors remains a persistent supply overhang.
The technical outlook would weaken if Bitcoin loses the $63,800 support area and closes below the ascending trendline. CoinGlass heatmaps identify heavy liquidation near $63,000 and another cluster around $61,800, making those levels potential downside magnets during a deeper correction.
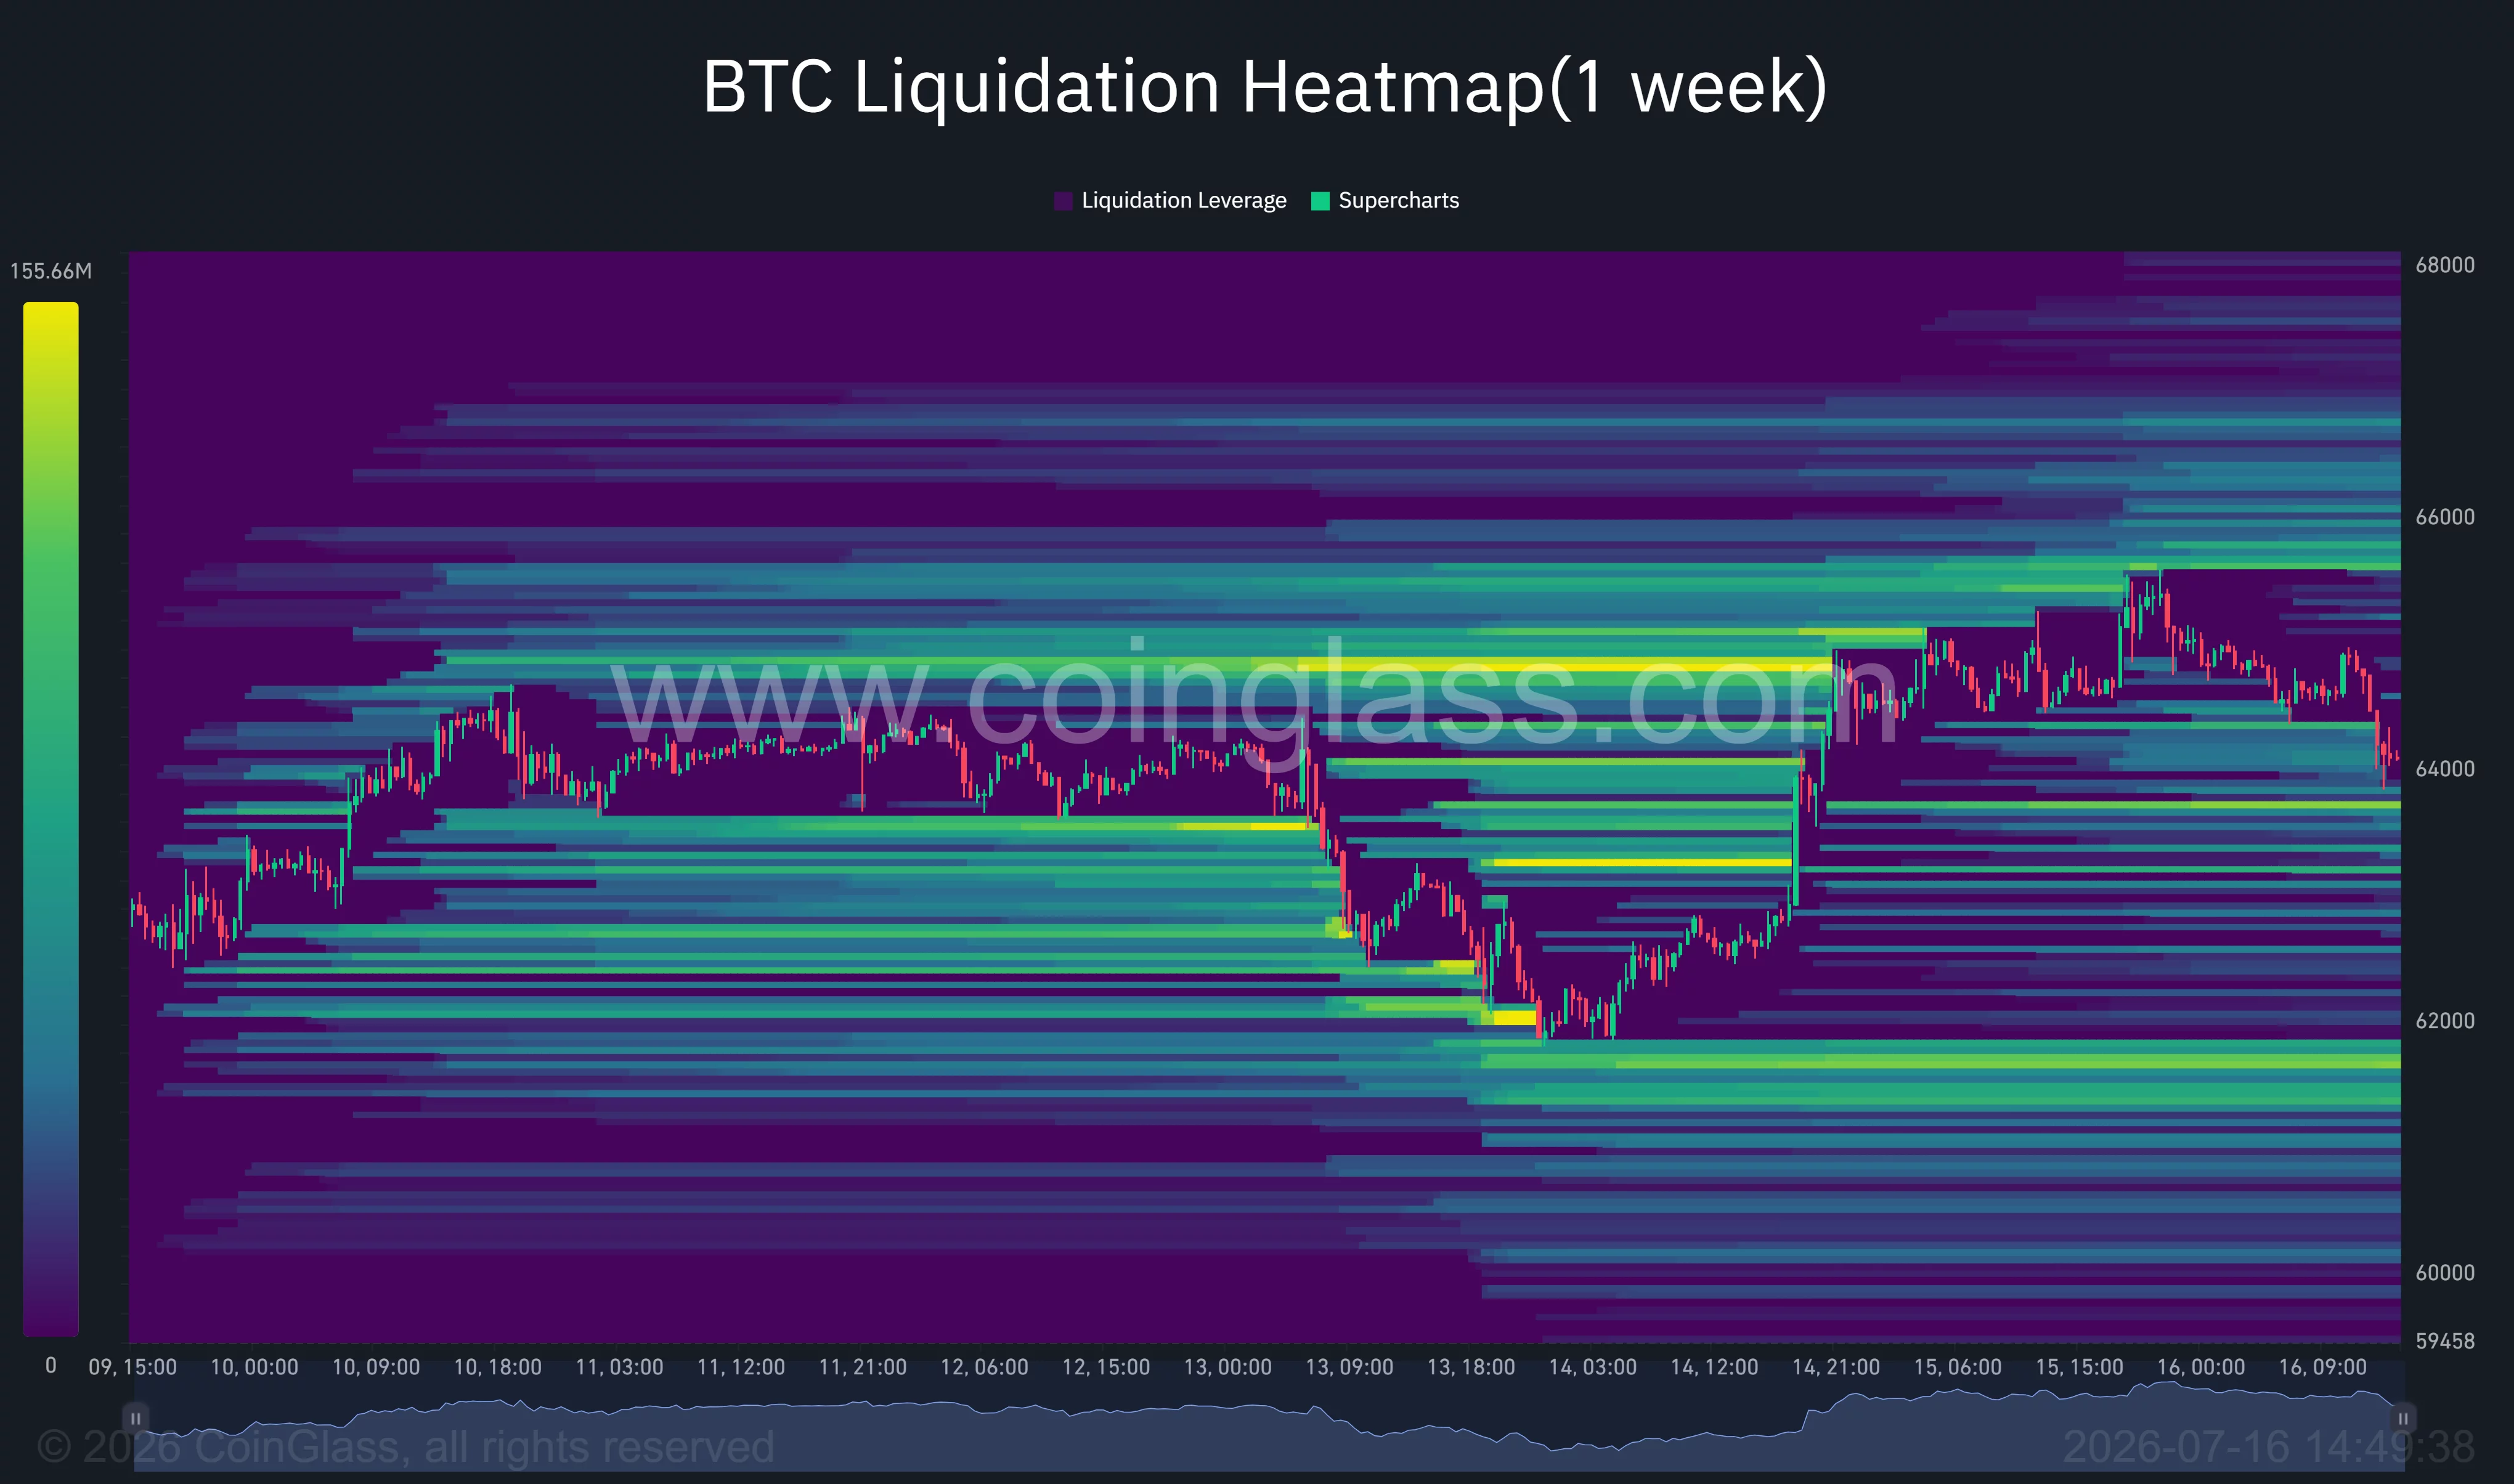
On the upside, reclaiming $65,000 on a daily closing basis would likely expose the $65,500 liquidity pocket before traders begin targeting the $67,000 region.
Disclosure: This article does not represent investment advice. The content and materials featured on this page are for educational purposes only.



Be the first to comment