


Bitcoin price rebounded about 6% over the past 24 hours to trade near $81,300, with a short squeeze and improving technical momentum carrying the price to its highest level in two weeks.
Summary
- Bitcoin price recovered from below $77,000 and climbed past $81,000 within 24 hours.
- The 4-hour Supertrend flipped bullish, with support now near $78,677.
- Daily RSI rose to 64.48, showing strong momentum without reaching overbought territory.
- A break above $83,000 could confirm a broader bottom, according to analyst Ted Pillows.
Bitcoin price action today
Bitcoin (BTC) price traded at approximately $81,330 at the time of writing after reaching an intraday high near $81,741, according to the daily chart. The move extended a sharp recovery from the $75,000–$76,000 area and erased the losses recorded earlier in the week.

The cryptocurrency gained roughly 6% over 24 hours, outperforming after a week dominated by tighter monetary policy and uncertainty surrounding U.S. crypto legislation.
The rebound accelerated after BTC reclaimed its True Market Mean near $76,660. The move forced traders holding leveraged short positions to buy back Bitcoin as prices moved against them, contributing to more than $250 million in short liquidations over the past day.
Forced buying helped BTC clear resistance at $78,000 and $80,000 before testing the low-$81,000 range. Bitcoin-related U.S. stocks also rallied, with Coinbase, Strategy and Robinhood recording strong gains during Friday trading.
The price recovery came despite the Federal Reserve’s first interest-rate increase in three years and the failure of the CLARITY Act in the U.S. Senate. Both developments had weighed on sentiment earlier in the week.
Bitcoin technicals turn bullish above $78,600
Bitcoin’s 4-hour chart shows that the Supertrend indicator has flipped from bearish to bullish. Its current support line sits near $78,677, leaving the short-term bullish structure intact while the price remains above that level.
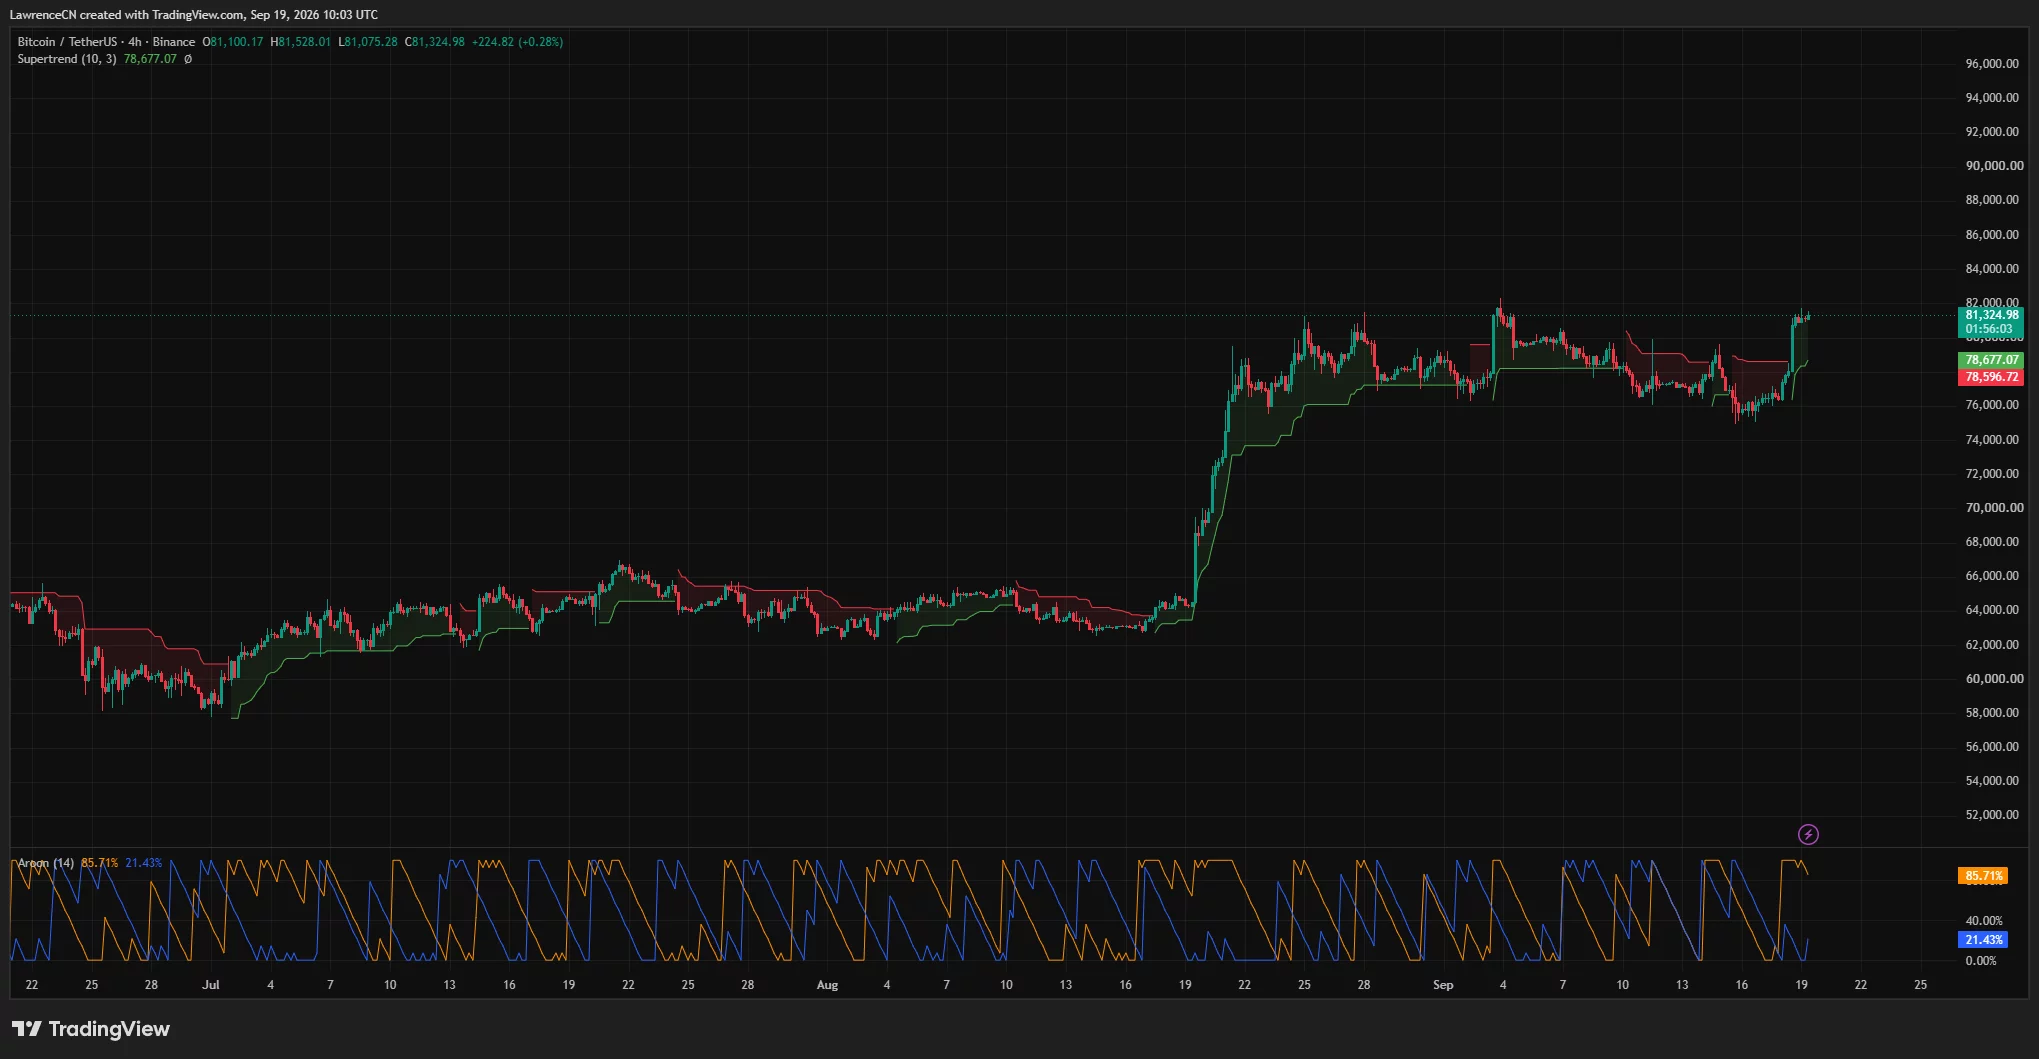
The Aroon indicator also points to stronger upward momentum. Aroon Up stood at 85.71%, compared with an Aroon Down reading of 21.43%. The gap suggests that Bitcoin has recently recorded stronger highs while downside momentum has weakened.
However, Aroon Up has started to turn lower from 100%, meaning buyers may need another push above the recent high to maintain the strength of the signal.
On the daily chart, Bitcoin has moved above the Bollinger Bands’ 20-day middle line at $78,346 and is approaching the upper band at $81,745. A daily close above the upper band could support an extension toward the next resistance zone, although a rejection may send the price back toward the middle band.
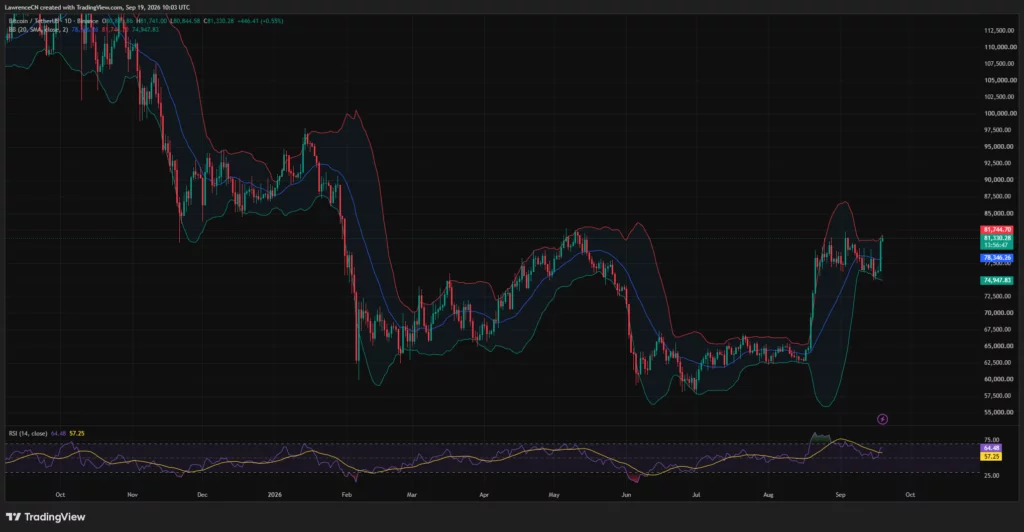
Daily RSI has risen to 64.48 from its signal average of 57.25. Momentum remains bullish, but the indicator is approaching the 70 level commonly associated with overbought conditions.
The combination of a bullish Supertrend, a positive Aroon spread, and an RSI reading above 60 favors buyers. However, Bitcoin is now testing an area that has repeatedly limited gains since late August.
Liquidation heatmap points to $82,000 resistance
CoinGlass’ three-day liquidation heatmap shows a dense band of leveraged positions between approximately $81,800 and $82,000. The cluster sits directly above the current price and could attract Bitcoin if buyers sustain the rally.
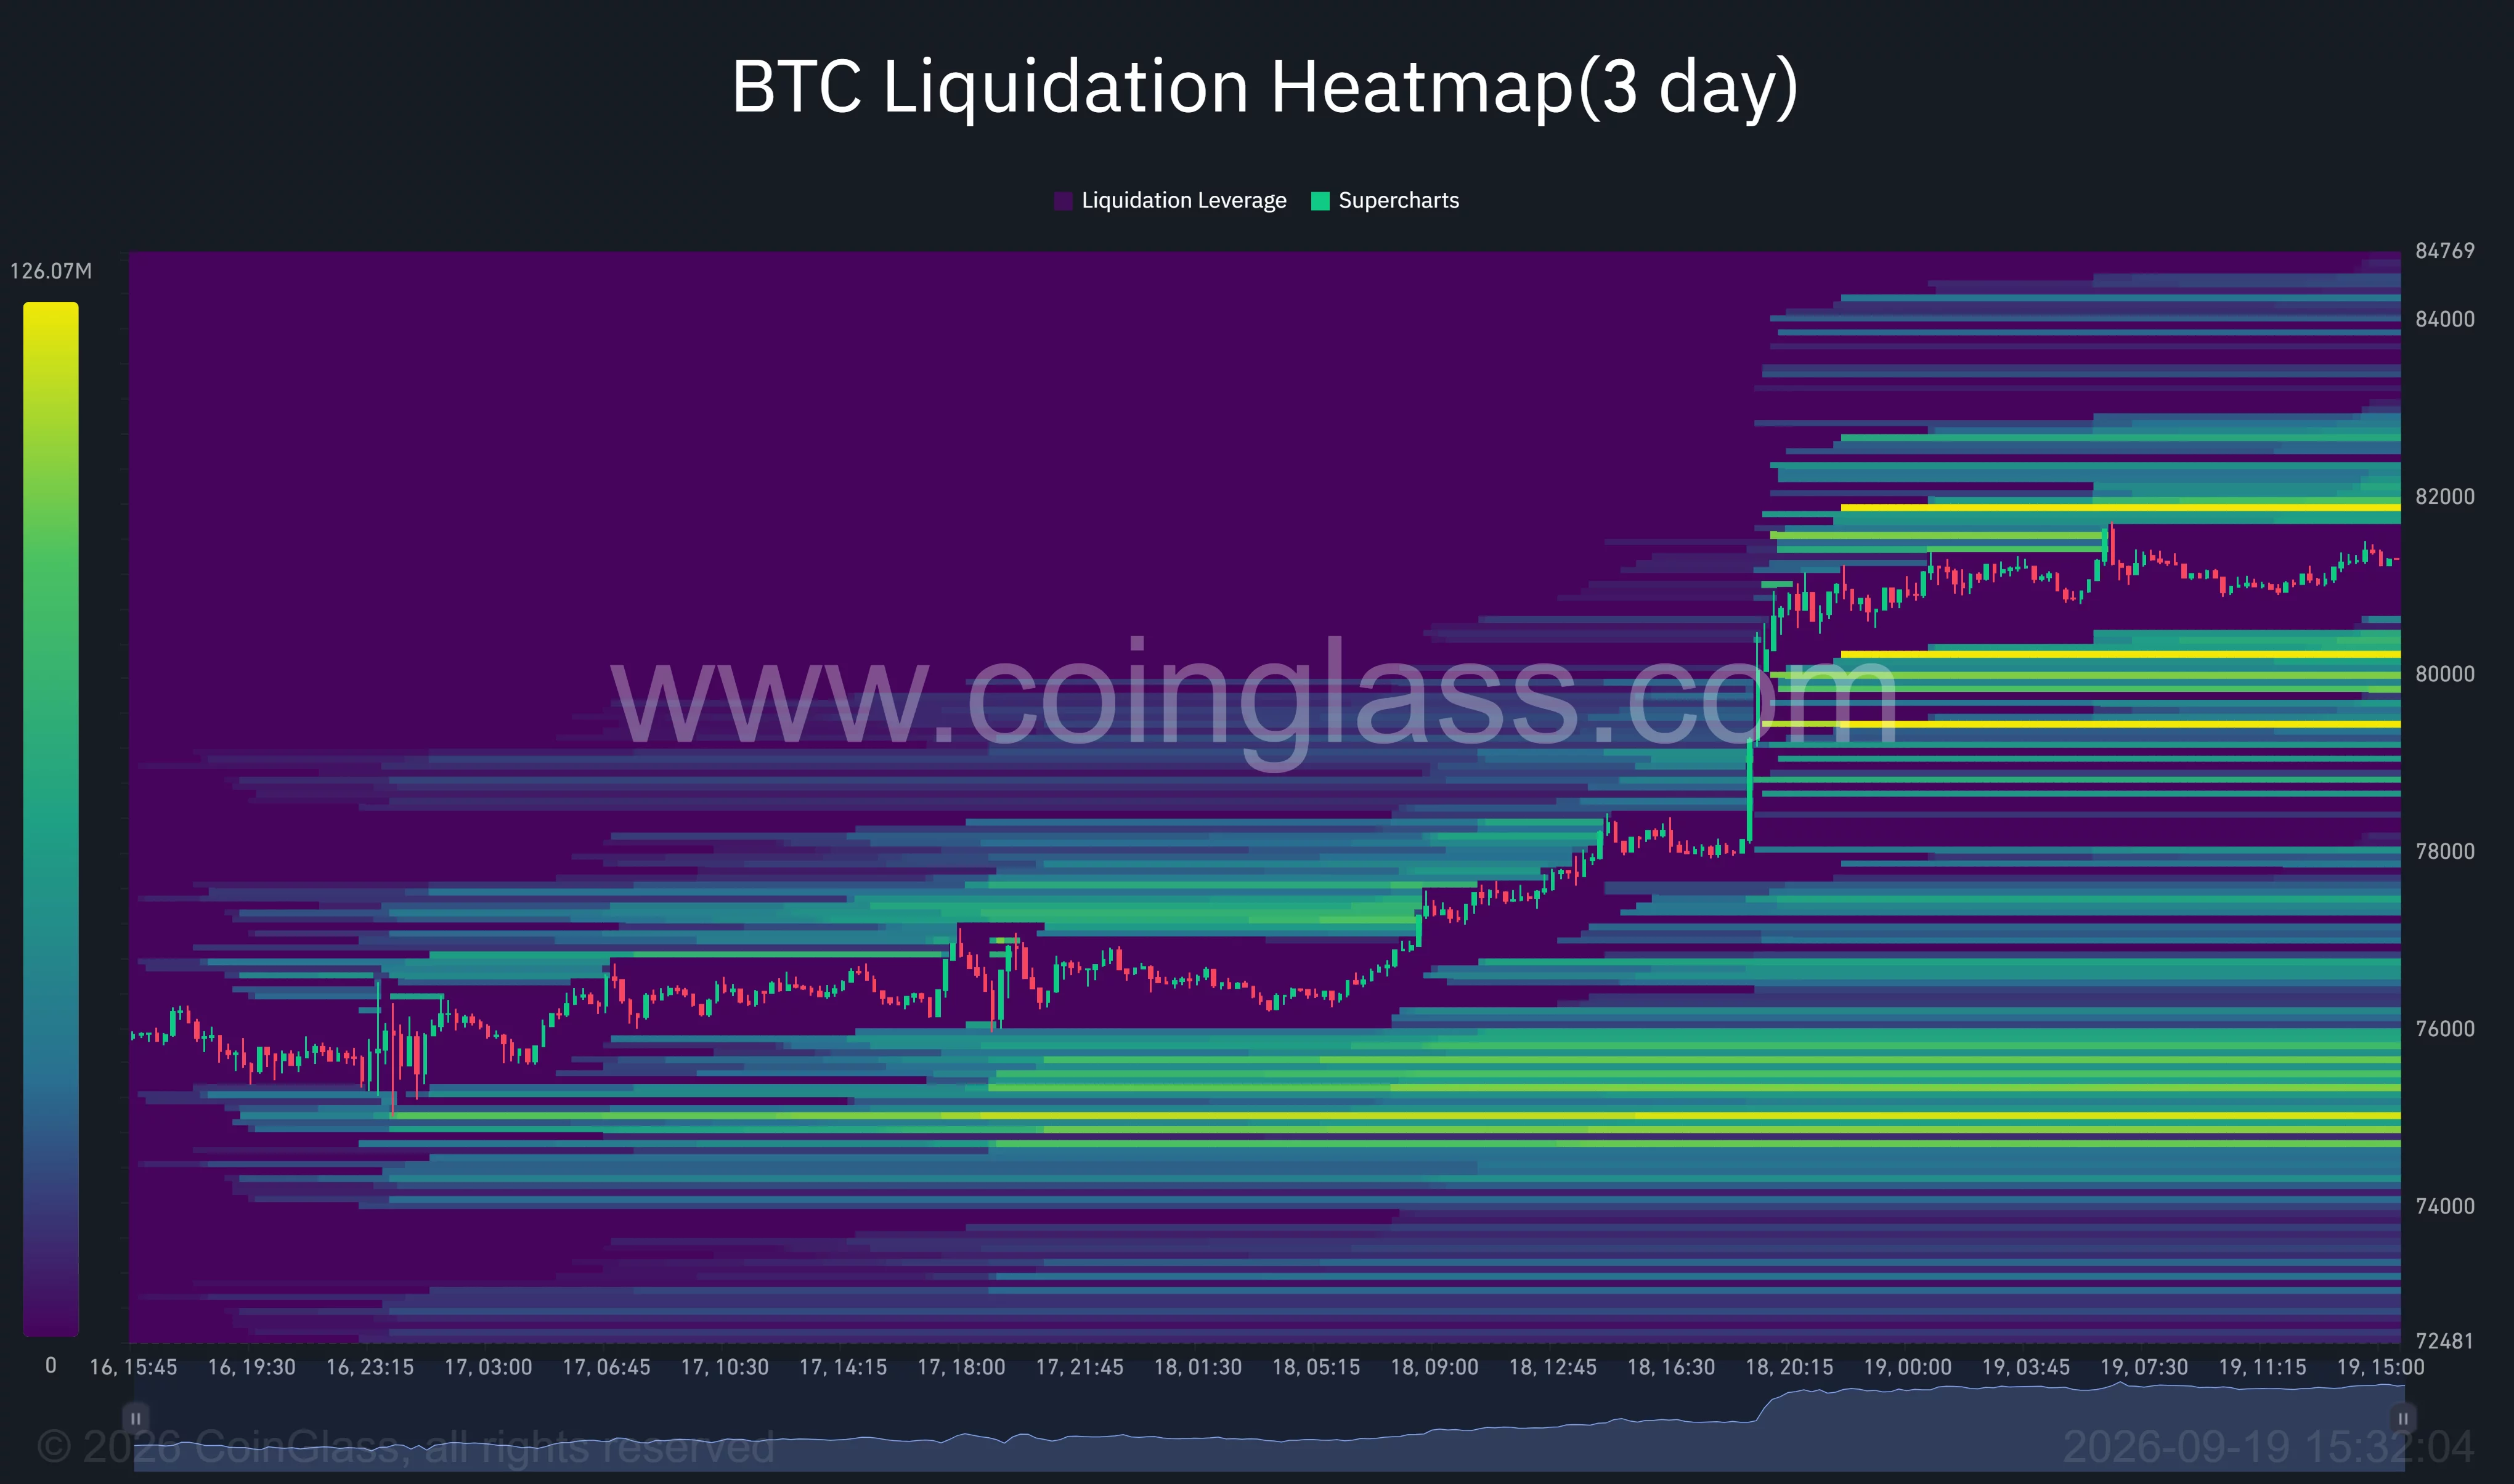
A move through $82,000 would expose additional liquidity near $82,500–$83,000. Further liquidation bands appear around $84,000, giving bulls a sequence of possible upside targets if the short squeeze continues.
The largest nearby pools below the market sit around $80,000 and $79,400. Bitcoin could revisit either area if traders take profits following the rapid advance.
Liquidity is also concentrated between $78,500 and $79,000, close to the 4-hour Supertrend and daily Bollinger midpoint. The overlap makes the region an important support zone for the current recovery.
A deeper decline would bring $75,000–$76,000 back into focus. The heatmap shows a broad concentration of leveraged positions in that range, while the daily lower Bollinger Band stands near $74,948.
Heatmaps identify areas where leveraged positions may face liquidation, but they do not guarantee that price will reach those levels.
Analysts watch $83,000 for bottom confirmation
Crypto analyst Ted Pillows said Bitcoin appeared set to close above its 50-week moving average. He identified $83,000 as the level BTC must clear to confirm that a market bottom has formed.
A sustained move above $83,000 would also break the upper part of the range that has contained Bitcoin since its August rally. Confirmation would place $85,000 in view before the market attempts a larger recovery.
Analyst Gerla said Bitcoin was holding the $81,000–$85,000 area after a bullish RSI divergence played out. According to the analyst, converting the zone into support could open a path toward $101,000–$105,000.
The higher target remains conditional because Bitcoin has not yet cleared either $83,000 or the full $81,000–$85,000 resistance range. Immediate technical conditions support the rebound, but a rejection below $82,000 would leave BTC vulnerable to another test of $80,000 and $78,600.
US macro risks remain in focus
The rally followed a difficult week for U.S. crypto investors. The Senate’s rejection of the CLARITY Act delayed efforts to establish a federal digital-asset market structure, while spot Bitcoin ETFs recorded nearly $746 million in net outflows during the midweek selloff.
The Federal Reserve also raised interest rates by 25 basis points, increasing the appeal of yield-bearing government debt relative to assets such as Bitcoin. The Bank of Japan then lifted its benchmark rate to 1.25%, adding another source of uncertainty for global liquidity.
Bitcoin has so far absorbed those pressures, but $83,000 remains the main test for the recovery. A confirmed breakout could extend the squeeze toward $85,000, while a failure to hold $80,000 would shift attention back to the $78,300–$78,700 support region.
Disclosure: This article does not represent investment advice. The content and materials featured on this page are for educational purposes only.


Be the first to comment