



Bitcoin price has fallen toward $80,800, bringing its 50-day moving average into focus as a bearish daily MACD crossover and an oversold 4-hour RSI put the $80,000 level under pressure.
Summary
- Bitcoin price traded near $80,800 on Oct. 8, below its daily 20-day moving average.
- The daily MACD line fell below its signal line, with the histogram turning negative.
- The 4-hour RSI dropped to 21.15 as Bitcoin slipped below its lower Bollinger Band.
- Analysts identified $78,000 and $75,000 as possible downside levels if nearby support fails.
TradingView’s Binance BTC/USDT daily chart showed Bitcoin trading at $80,806 on Oct. 8, down 3.02% from the session’s opening price of $83,321. The session’s low stood at $80,393, putting the latest decline below the $81,981 low mentioned during the earlier sell-off.

Bitcoin’s daily chart shows a retreat from the late-September and early-October peaks around $87,000. The latest decline has also taken the price below $84,000, leaving BTC close to a moving average that supported its recovery from the August lows.
Bitcoin price tests its 50-day moving average
On TradingView’s daily chart, Bitcoin’s 50-day simple moving average stood at $80,526, just below the latest price. The session’s low briefly moved beneath that average before BTC returned above it.
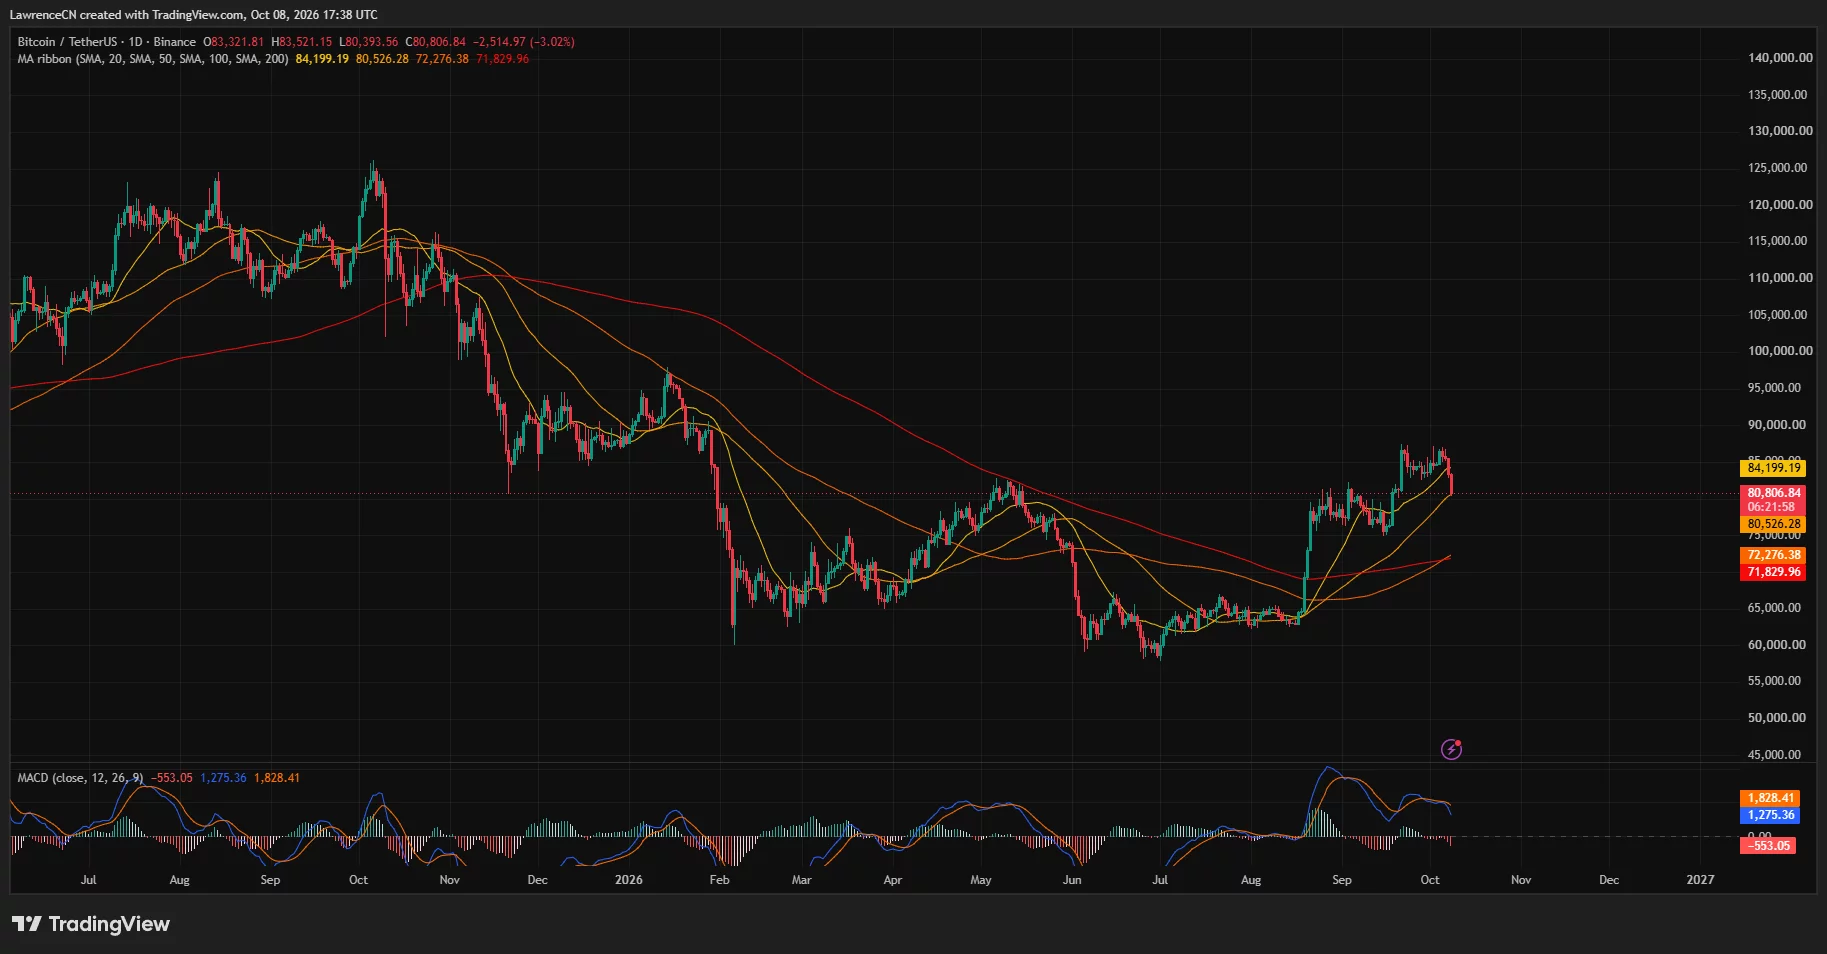
The 20-day moving average stood considerably higher at $84,199. Based on those readings, Bitcoin would need to recover roughly 4.2% from $80,806 to regain its short-term average.
The gap between the two averages places Bitcoin at a technical decision point. Holding the 50-day average would preserve that support reference, while a sustained break below it would leave the round-number $80,000 level as the next nearby test.
TradingView’s daily price history shows earlier trading activity around $78,000–$80,000 during August and September. Beneath that range, the chart contains another area of previous consolidation around $75,000–$76,000.
The longer-term averages remain lower. Bitcoin’s 100-day moving average stood at $72,276, while its 200-day average was $71,830. BTC therefore remained above both despite losing its 20-day average and approaching the 50-day line.
The daily MACD added a bearish momentum signal. Its line stood at 1,275.36, below the signal line at 1,828.41, producing a negative histogram reading of 553.05.
Both MACD lines remained above zero, but their bearish crossover accompanied the latest price decline. On the daily chart, the earlier recovery’s positive momentum has weakened while the price tests a nearer support level.
The 4-hour RSI falls to 21 as selling extends
TradingView’s 4-hour chart showed Bitcoin trading at $80,832, with its relative strength index at 21.15. The reading fell below the conventional oversold threshold of 30 and below the RSI’s moving average of 36.05.
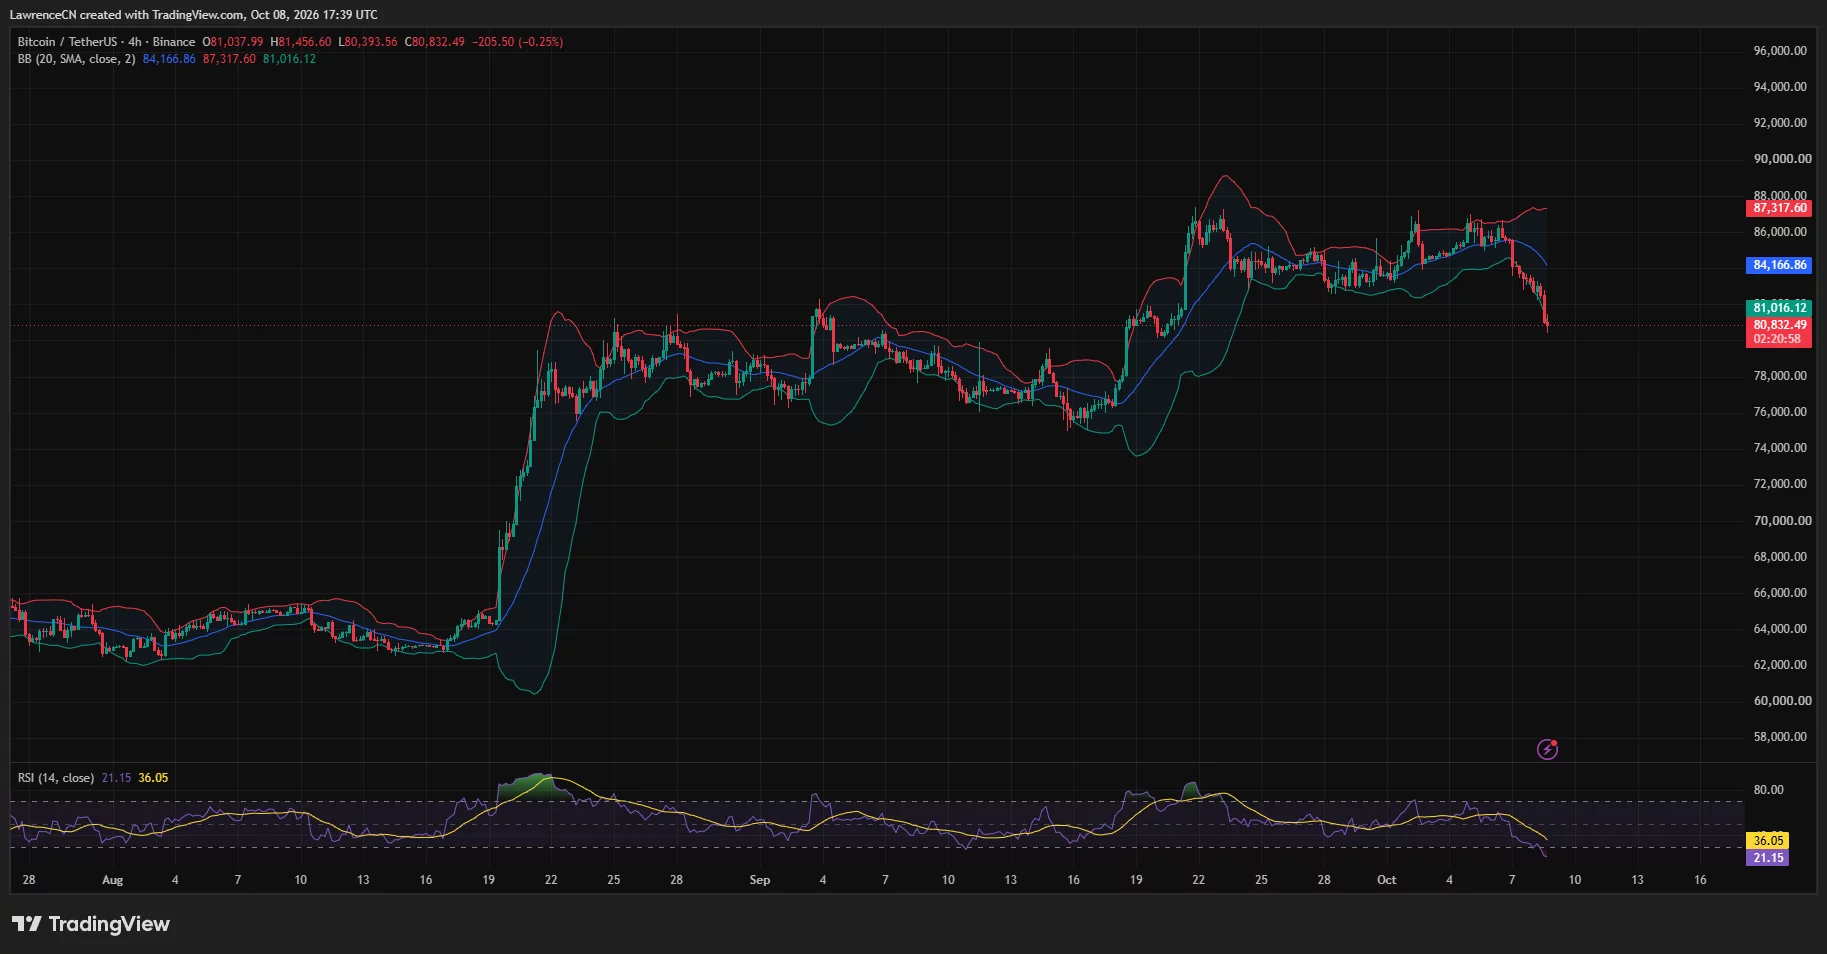
The same chart placed Bitcoin beneath its lower Bollinger Band at $81,016. The middle band stood at $84,166, while the upper band was $87,317.
Those readings show that the latest selling pushed BTC below the lower boundary of its recent volatility range. An oversold RSI leaves room for a rebound, but a recovery would still face several overhead levels before reversing the breakdown.
The first nearby reference is the lower Bollinger Band around $81,000. Above it, the $81,500–$82,000 region identified by analyst Ted becomes relevant, followed by the middle band near $84,166.
The daily 20-day average and the 4-hour middle Bollinger Band sit close together around $84,200. Their overlap makes that area a clear chart reference for assessing whether a rebound regains strength.
Bitcoin’s 4-hour price history also shows repeated trading near $85,000–$87,000 before the decline. Recovering $84,200 would bring that former range back into view, while another rejection below it would leave the latest breakdown unresolved.
Liquidation heatmap shows large clusters above Bitcoin
CoinGlass’s three-day liquidation heatmap tracks Bitcoin’s slide from approximately $86,000–$86,500 toward $80,800. At the right edge, visible liquidation bands sit near $80,500–$80,700 and around $82,000.
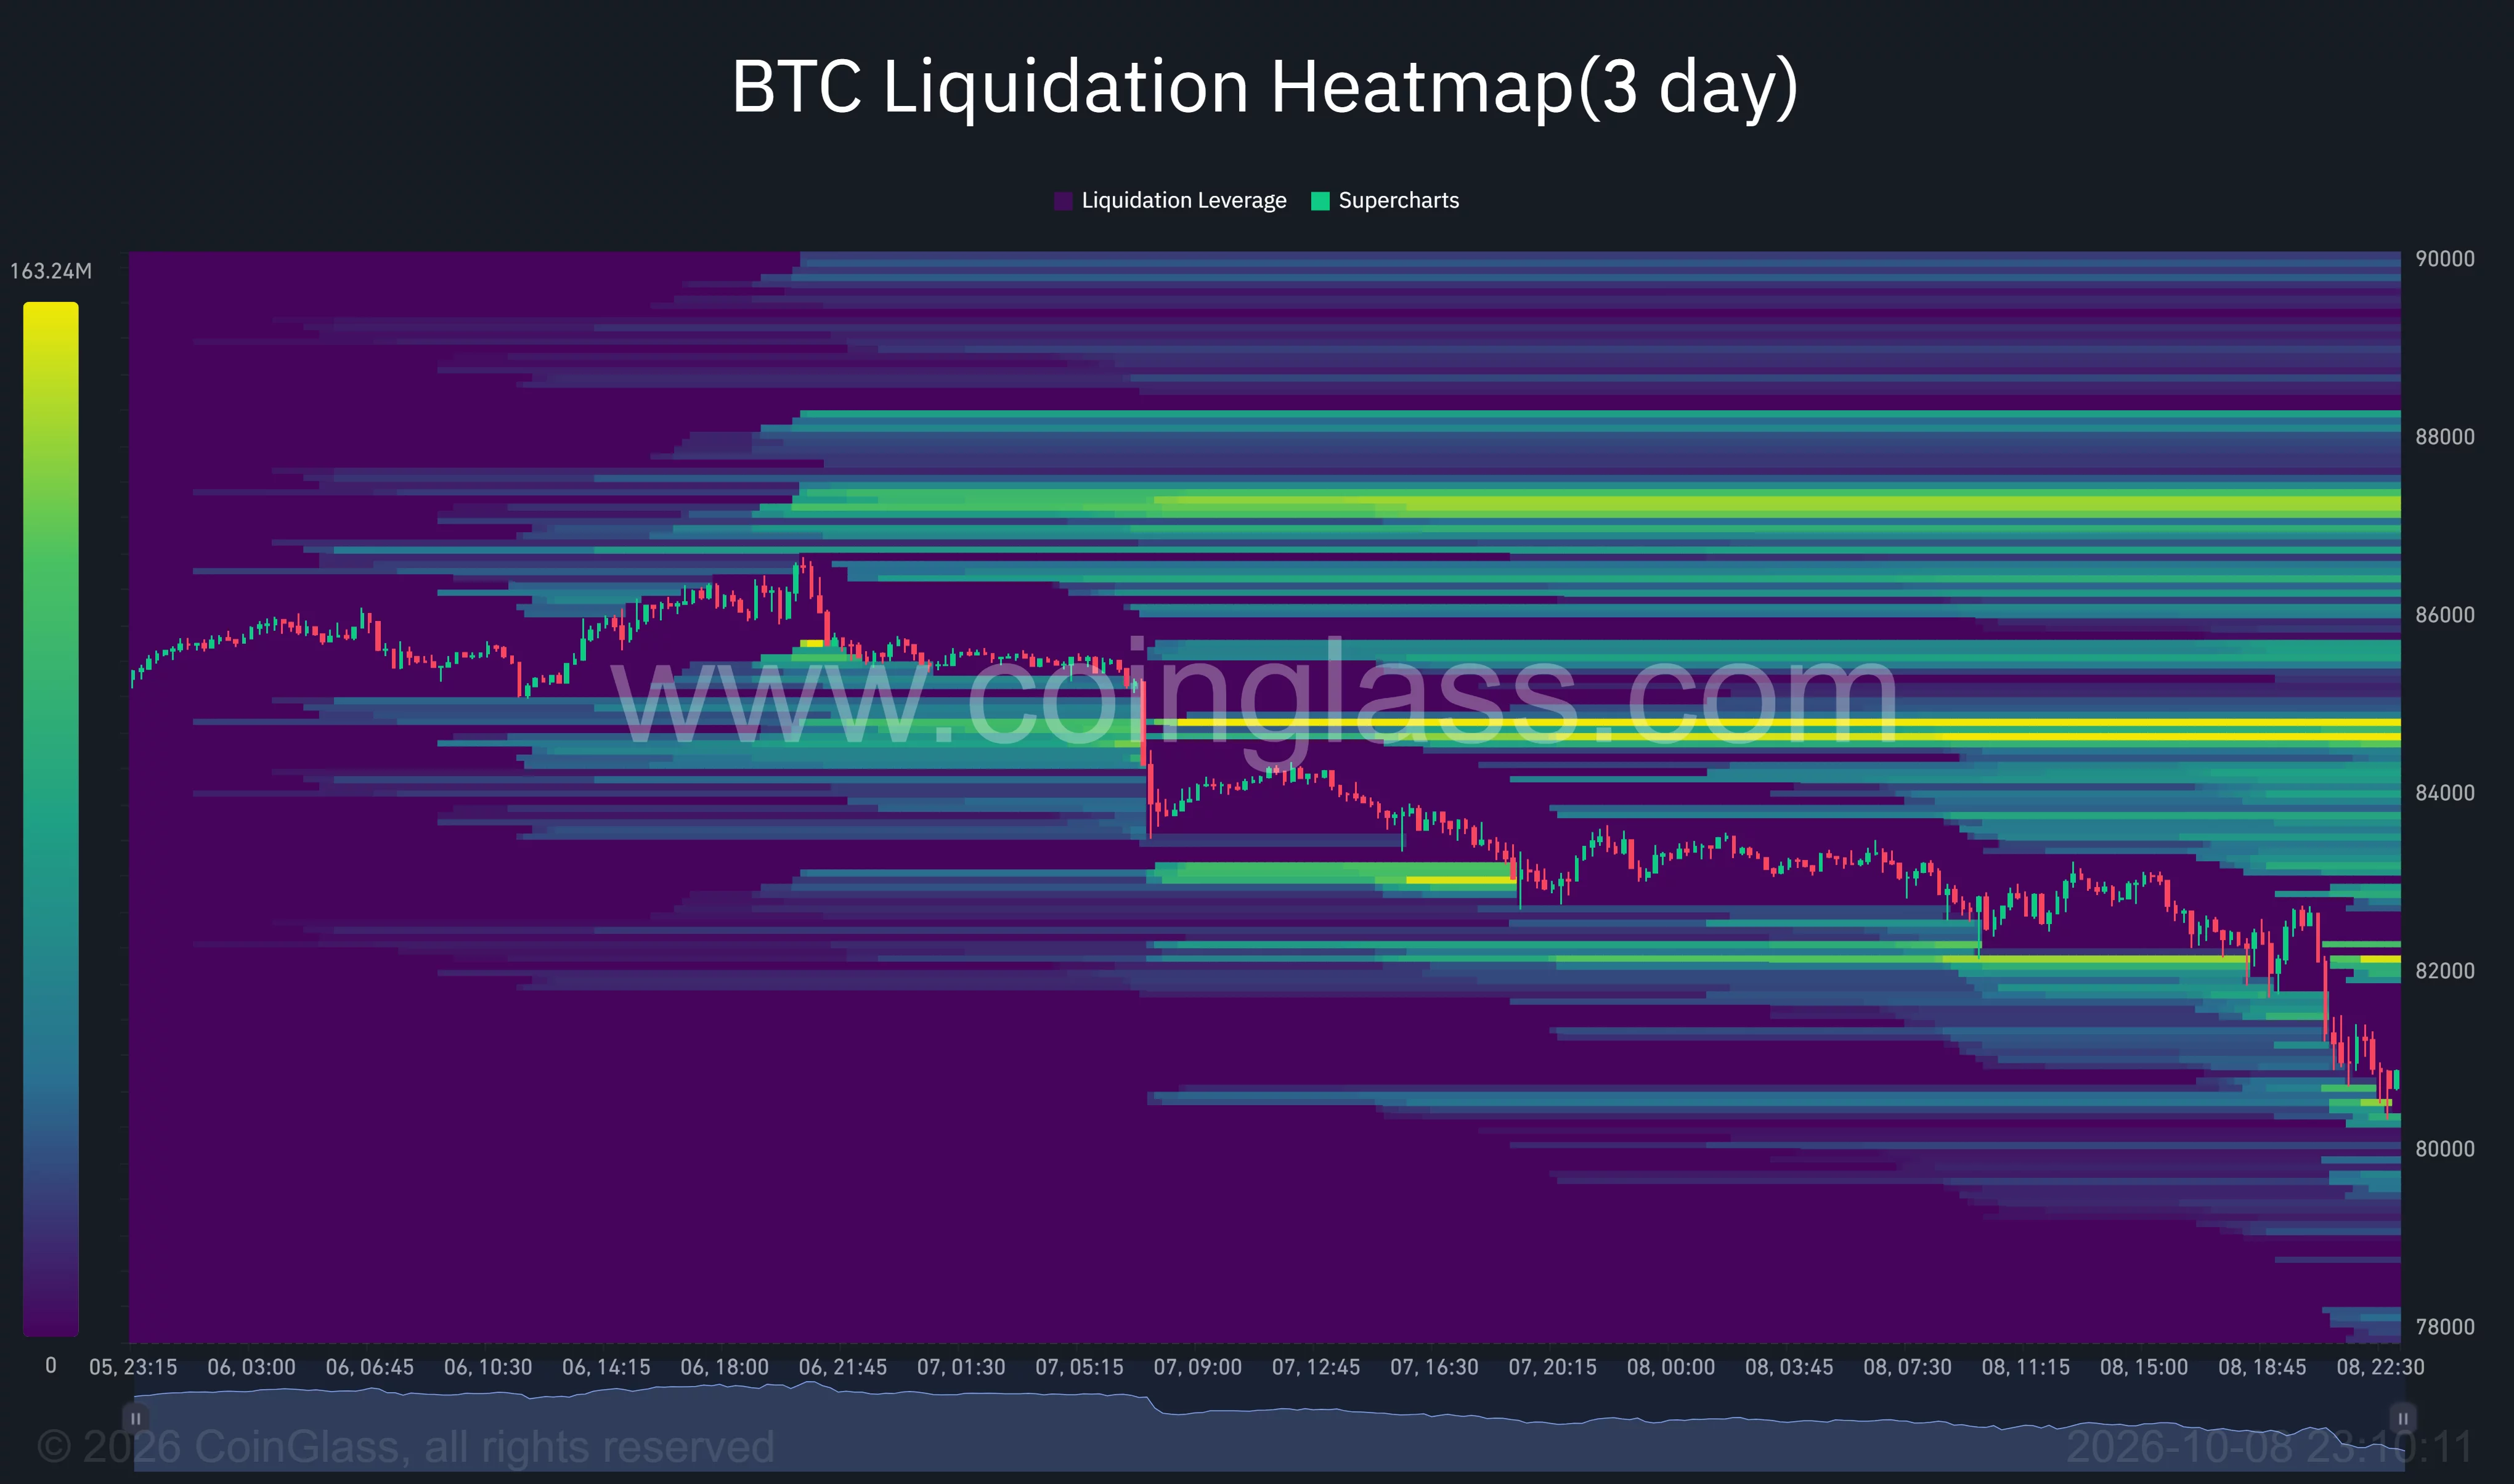
Larger overhead concentrations appear around $84,600–$84,800 and approximately $87,200–$87,400. The heatmap places substantial estimated liquidation exposure above the latest price, alongside smaller nearby bands below it.
During the earlier leg of the decline, CoinGlass data showed $555.6 million in total crypto liquidations over a 24-hour period, including $487.2 million in long positions. Bullish bets accounted for about 87.7% of that total.
That liquidation window covered the move below $84,000 reported before the latest charts. By Oct. 8, TradingView showed Bitcoin trading lower, near $80,800, extending the price decline beyond the levels recorded in that earlier report.
Analysts outline $78,000 and $75,000 downside scenarios
In an Oct. 8 post, analyst Ted forecast that Bitcoin could reach $78,000 during the month. He identified $81,500–$82,000 as the immediate area to watch and said losing it could lead to $75,000 before a stronger uptrend.
Bitcoin’s latest TradingView readings were already below that range. A recovery above $82,000 would therefore reclaim the analyst’s identified zone, while continued trading beneath it would keep his downside scenario relevant.
Analyst Ardi separately described Bitcoin’s structure as a completed double top and focused on a retest of the prior trading range. He said losing that range as support could send BTC back into the $70,000s.
Ardi’s forecast depends on the range failing; it does not establish a fixed outcome. The daily chart’s nearby 50-day average at $80,526 provides a more immediate reference before the lower levels identified by either analyst.
For U.S. investors following Bitcoin alongside domestic market trading, the Binance chart places the immediate technical test around $80,400–$80,500, followed by $80,000. A recovery would first need to regain $81,500–$82,000, with the overlapping indicators near $84,200 providing the next test.
Bitcoin’s bearish momentum readings favor caution around those support levels, while its oversold 4-hour RSI leaves a rebound possible. The next chart signal is whether BTC holds the 50-day average and recovers $82,000, or extends the decline through $80,000 toward the analysts’ lower targets.
Disclosure: This article does not represent investment advice. The content and materials featured on this page are for educational purposes only.


Be the first to comment