



What to know:
- Bitcoin price dropped from $79K to $74K before rebounding near $77K as selling pressure eased.
- Glassnode data shows momentum down 21.7% while CVD signals point to improving balance in flows.
- CRYPFLOW highlights a 12D MACD bullish cross, signaling long-term cycle transition signals.

The latest Bitcoin price action showed a clear cooling phase as it moved from $79,000 down to $74,000 before recovering toward $77,000.
This shift in Bitcoin price came alongside weakening momentum, which dropped by 21.7%, reflecting slower upside strength and increased caution among traders.

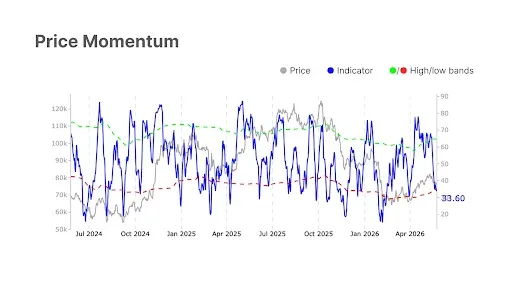
Source: Glassnode

Notwithstanding the sell-off, the correction was orderly for the Bitcoin price without any panicked selling. The spot and perpetual funding rates surged by 77.2% and 35.5%, respectively, suggesting a reduction in selling pressure.
Moreover, spot volumes fell by 10% while futures’ open interest decreased by 3.5%, implying fewer speculations. Despite all that, the Bitcoin price rebounded to approach the $77,000 mark.
Glassnode Metrics and Bitcoin Price Stabilization Signals
According to Glassnode’s data, there is now relative calm within the Bitcoin price. While momentum may have decreased, the cumulative volume delta readings have shown massive improvements compared to previous levels as buyers now absorb more volume in the spot and perpetual markets.
The behavior of the Bitcoin price in response indicates that traders have been moving towards consolidations and away from selling.
The long position financing rates went up by 135.4%, indicating that there is still an appetite for going long despite the drop. ETF factors contributed to stability, as net flows went up by 28.9%, despite the fall in the trade volume by 22.9%.
Active daily addresses, as well as the transfers, went down somewhat, implying that there is some reduction in the use of the network. However, the consistent liquidity ratios suggest that the long-term holders are not selling off.
Also Read: American Bitcoin Corp Adds 200 BTC, Boosting Corporate Treasury Holdings
MACD Cycle Outlook and Bitcoin Price Structure
Long-term price analysis provided by CRYPFLOW reveals a repeated pattern based on the MACD 120-day indicator for Bitcoin price. In the years 2015, 2018, and 2022, bear market cycles started after a slowdown of momentum and were followed by significant retracements.
Currently, the chart displays a bearish MACD cross after significant retracement from rallies observed in 2024 and 2025, indicating that the price momentum may slow down soon.


Source: X
It does not mean the imminent collapse of the Bitcoin price, yet it may imply that upward price momentum may be slowing down and trading flat for months ahead.
According to the analyst, flows of funds into organizations and increased ETF activity will moderate the impact of future drops; however, the whole cycle of the Bitcoin price is undergoing transformation.
Considering repetition of patterns, the present phase will move towards 2026, when bottoms often emerge following prolonged deceleration of momentum and sentiment correction.
This article contains market analysis and price predictions. These are not guarantees. Crypto markets are volatile. Always DYOR. Not financial advice.
Also Read: BlackRock Bitcoin Selloff Tops $1B as BTC Holds Firm



Be the first to comment