



Bitcoin price traded just below $78,000 on Sept. 1 after retreating from the $81,000 area, as fading trend strength, Federal Reserve rate concerns and nearby liquidation clusters kept the cryptocurrency inside a narrow range.
Summary
- Bitcoin price fell about 1.9% over seven days after encountering resistance near $81,300.
- The 4-hour ADX dropped to 12.26, indicating weak directional momentum.
- Liquidation liquidity is concentrated around $81,000–$82,000 and $75,000–$77,000.
- A daily close above $82,842 would strengthen the case for another leg higher.
Bitcoin price consolidates after 25% August rally
According to data from crypto.news, Bitcoin (BTC) price was trading near $77,978 at press time, down about 0.8% on the day and roughly 1.9% over the past week. The asset has pulled back from a local high near $81,300 while holding above the $77,700–$77,800 area.

The decline followed a nearly 25% advance in August, Bitcoin’s strongest monthly performance since November 2024. Profit-taking increased as buyers struggled to push the price through the $81,000–$82,000 resistance zone.
The daily chart shows Bitcoin holding most of its August breakout despite the recent pullback. Price remains well above the Supertrend support at $72,310, while the indicator continues to show a bullish trend on the daily timeframe.
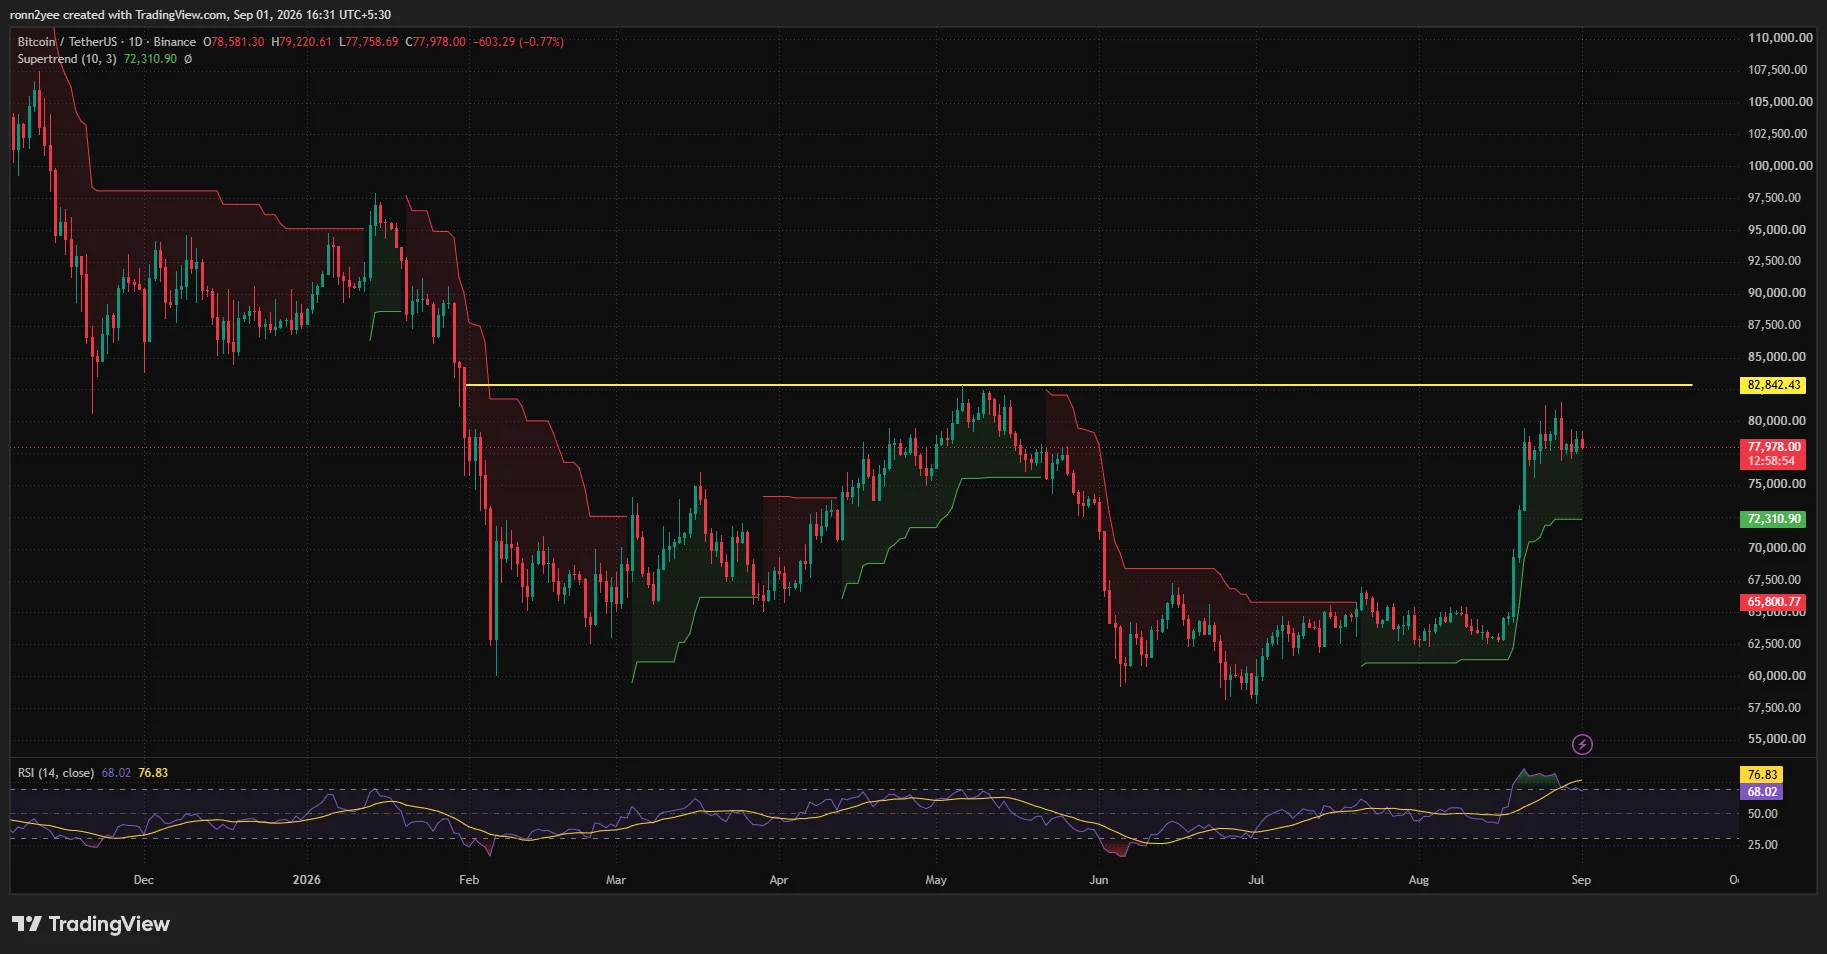
However, Bitcoin has repeatedly failed to sustain moves above $80,000. The rejection has left the price inside a short-term range, with neither buyers nor sellers showing enough strength to establish control.
The daily relative strength index stands at 68.02. Although the reading remains above the neutral 50 level, it has fallen below its moving average at 76.83, showing that bullish momentum has cooled since the August surge.
Fed concerns and ETF outflows limit demand
The pullback coincided with a more cautious US macroeconomic backdrop. Federal Reserve Chair Kevin Warsh said at Jackson Hole that policymakers would have “work to do” if inflation failed to move toward the central bank’s 2% target at a sufficient pace.
Warsh’s comments increased expectations that the Fed could consider another interest-rate increase. Higher rates can pressure Bitcoin because they raise the return available on government debt and reduce investors’ willingness to hold risk assets that generate no cash flow.
US spot Bitcoin exchange-traded funds also recorded about $201.8 million in net outflows on Aug. 28, according to SoSoValue data. The withdrawal ended a nine-session inflow streak that had brought more than $3 billion into the funds.
Institutional demand has not disappeared. Strategy disclosed that it purchased 4,603 BTC for approximately $370 million between Aug. 24 and Aug. 30 at an average price of about $80,318.
The US-listed company now holds 845,050 BTC. However, its latest purchase has not been enough to push the market back above the company’s recent acquisition price.
Bitcoin liquidity builds on both sides of the range
CoinGlass’s one-week Bitcoin liquidation heatmap shows substantial leveraged positions building above and below the current price.
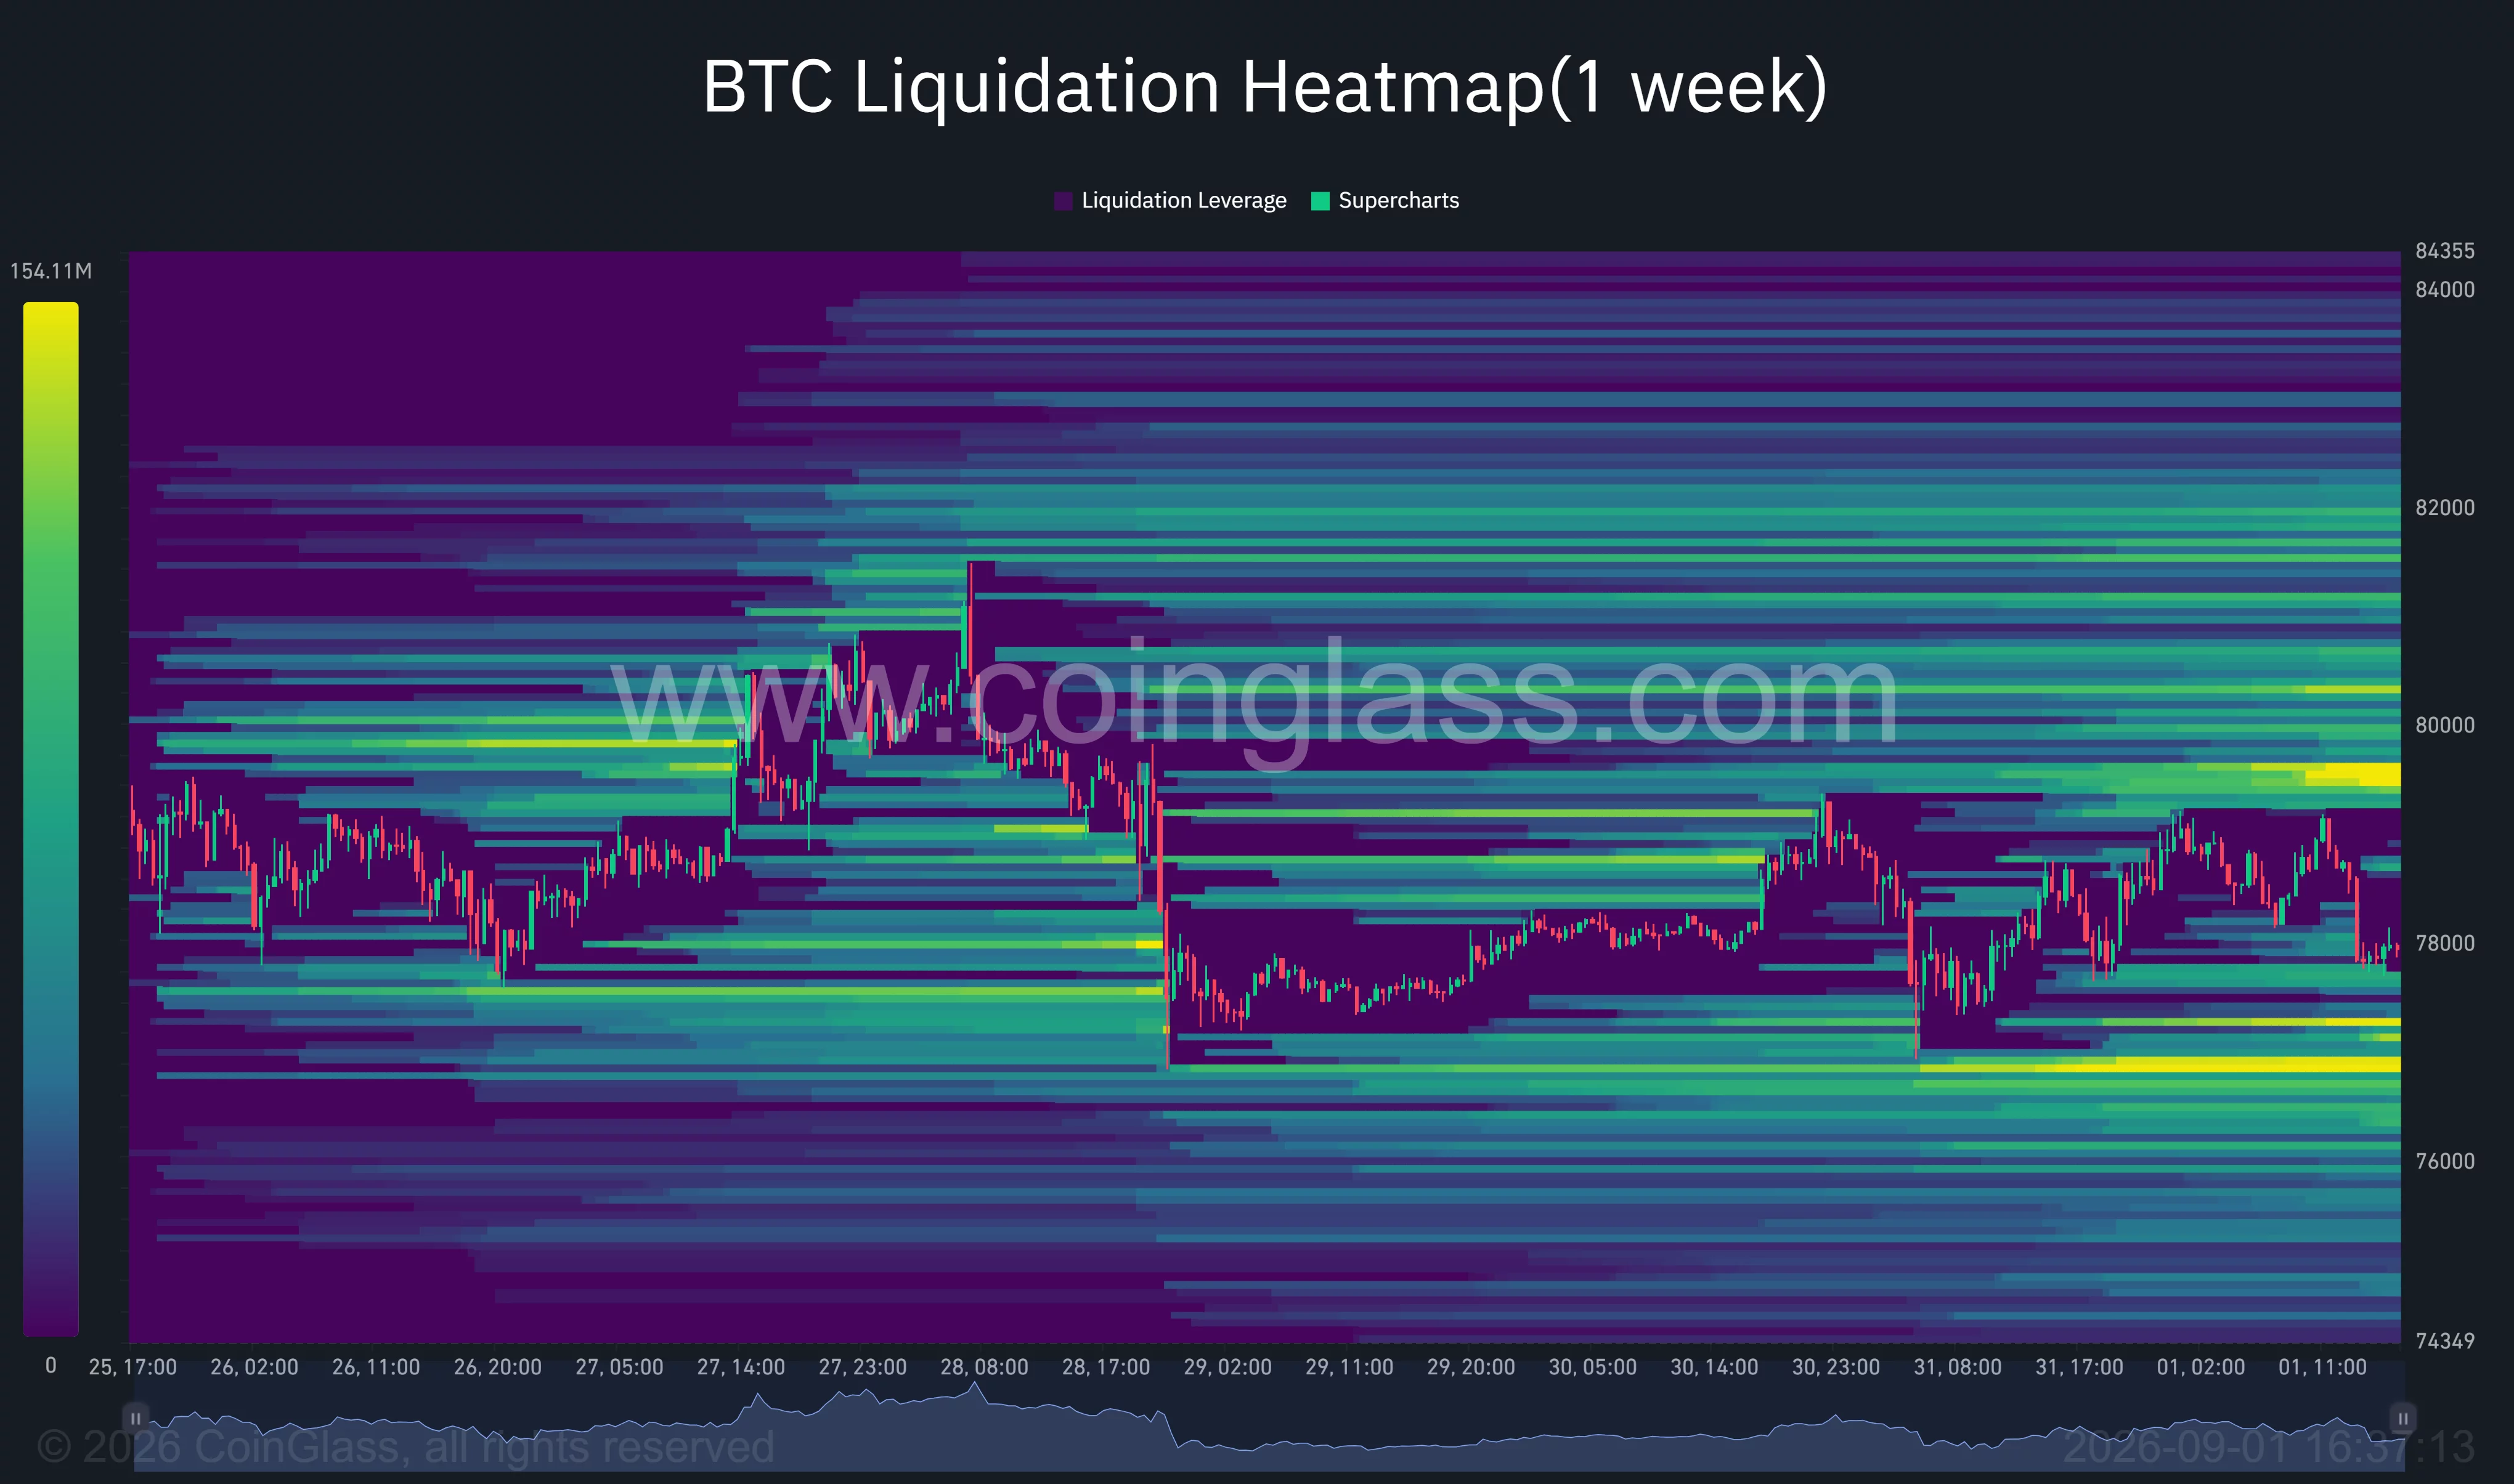
The closest large upside clusters sit around $79,500, $80,500, and $81,500–$82,000. A move into those areas could force short sellers to close positions, adding buying pressure and potentially accelerating a breakout.
The clearest downside liquidity is concentrated between approximately $76,500 and $77,000. Another pool extends toward $75,000, making the broader $75,000–$77,000 zone a possible target if Bitcoin loses its current floor.
Pseudonymous analyst Eliz also identified $81,000–$82,000 and $75,000–$77,000 as the two main liquidity areas. The analyst said the market had not received a sufficiently strong liquidity influx to produce a reliable directional setup.
The heatmap does not predict which cluster Bitcoin will reach first. It instead identifies areas where forced position closures could increase volatility once the price exits its present range.
Weak ADX points to continued range trading
Bitcoin’s 4-hour chart supports the consolidation outlook. The Bollinger Bands place their midpoint at $78,242, slightly above the current price.
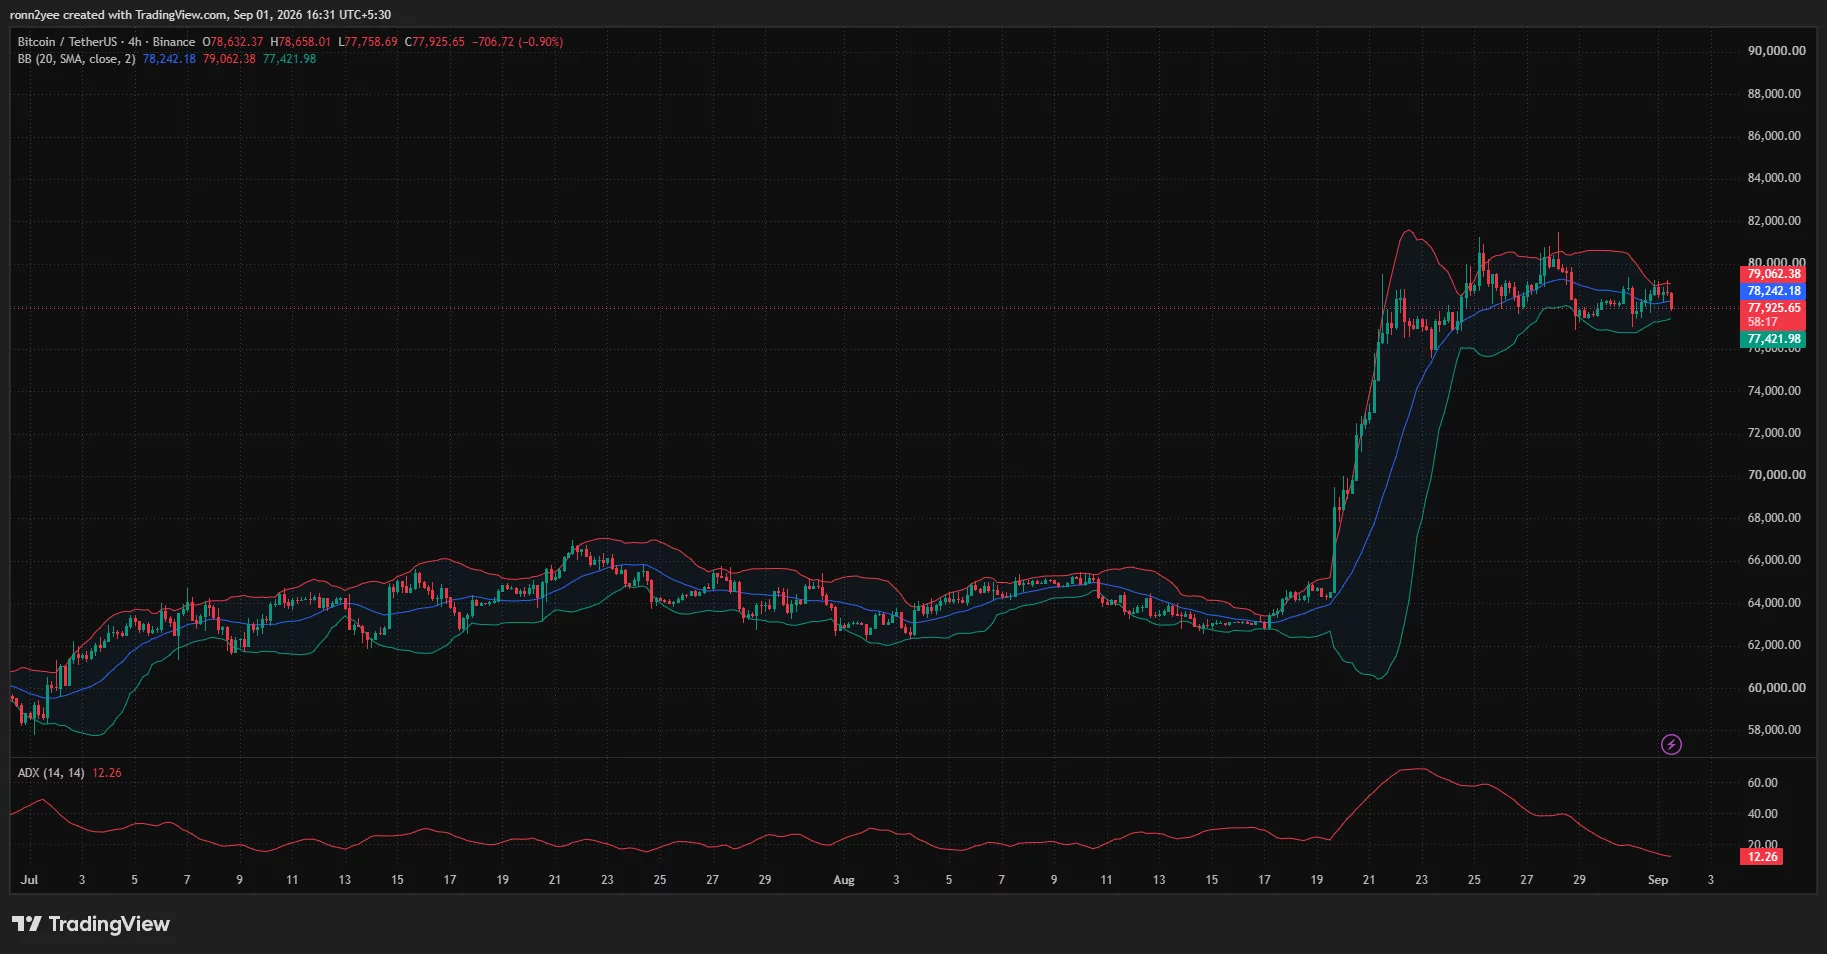
The upper Bollinger Band stands at $79,062, while the lower band is near $77,422. Price is trading in the lower half of the channel but has not produced a confirmed close below its lower boundary.
A break above $79,062 would put $80,000 back in focus, followed by the heavier liquidation zone around $81,000–$82,000. The daily chart places the next larger resistance level near $82,842.
A daily close above $82,842 would clear the recent high and could confirm that the August rally has resumed. Until then, repeated rejections below that level leave Bitcoin vulnerable to another range reversal.
On the downside, a sustained break below $77,422 would expose the liquidity cluster near $76,500–$77,000. Losing the broader $75,000 level could open a deeper pullback toward daily Supertrend support at $72,310.
The 4-hour average directional index has dropped to 12.26. Readings below 20 generally show that an asset lacks a strong trend, supporting the possibility of further sideways trading until Bitcoin breaks one of the range boundaries.
For US investors, ETF flows and interest-rate expectations remain the main near-term catalysts. A return to sustained spot ETF inflows could help buyers challenge $82,000, while renewed outflows or stronger rate-hike expectations could increase pressure on the $75,000–$77,000 support area.
Disclosure: This article does not represent investment advice. The content and materials featured on this page are for educational purposes only.



Be the first to comment