



Bitcoin price approached $65,000 on Aug. 6 as easing concerns over the Strait of Hormuz and improving technical momentum supported its recovery from the low-$62,000 region.
Summary
- Bitcoin price rallied nearly 4% from its Aug. 3 low before meeting resistance around $65,000.
- The 4-hour chart places the upper Bollinger Band at $65,221, reinforcing near-term resistance.
- Liquidation clusters sit near $65,000–$65,500, with downside liquidity concentrated around $63,000.
- A confirmed breakout could expose $67,365 and $68,000, while losing $63,700 would weaken the setup.
Bitcoin price action today
According to data from crypto.news, Bitcoin (BTC) traded around $64,615 at the time of writing after reaching an intraday high of $64,999. The move extended its recovery from approximately $62,300 on Aug. 3 to almost 4%.

The rebound followed reports of progress between Iran and Oman over a shipping route through the Strait of Hormuz. Iran’s Foreign Ministry said the two countries had reached an understanding on the route’s coordinates, although several details were still under discussion. The development has not guaranteed a permanent reopening of the waterway.
Brent crude remained below $80 as traders assessed whether the negotiations could reduce risks to global energy supplies. Lower oil prices can support crypto and other risk assets by easing inflation pressure, but any breakdown in talks could reverse that effect.
Bitcoin has still lagged the recent U.S. equity rally. The S&P 500 gained more than 3% during the opening days of August, while Bitcoin added about 2% over the same period. Bitcoin-specific concerns, including the COLDCARD wallet exploit and questions surrounding corporate treasury sales, have limited the recovery.
Bitcoin technical indicators favor further recovery
The 4-hour chart shows Bitcoin trading above the Bollinger Band basis at $64,020. The upper band stands at $65,221, making the $65,000–$65,220 area the first major obstacle for buyers.
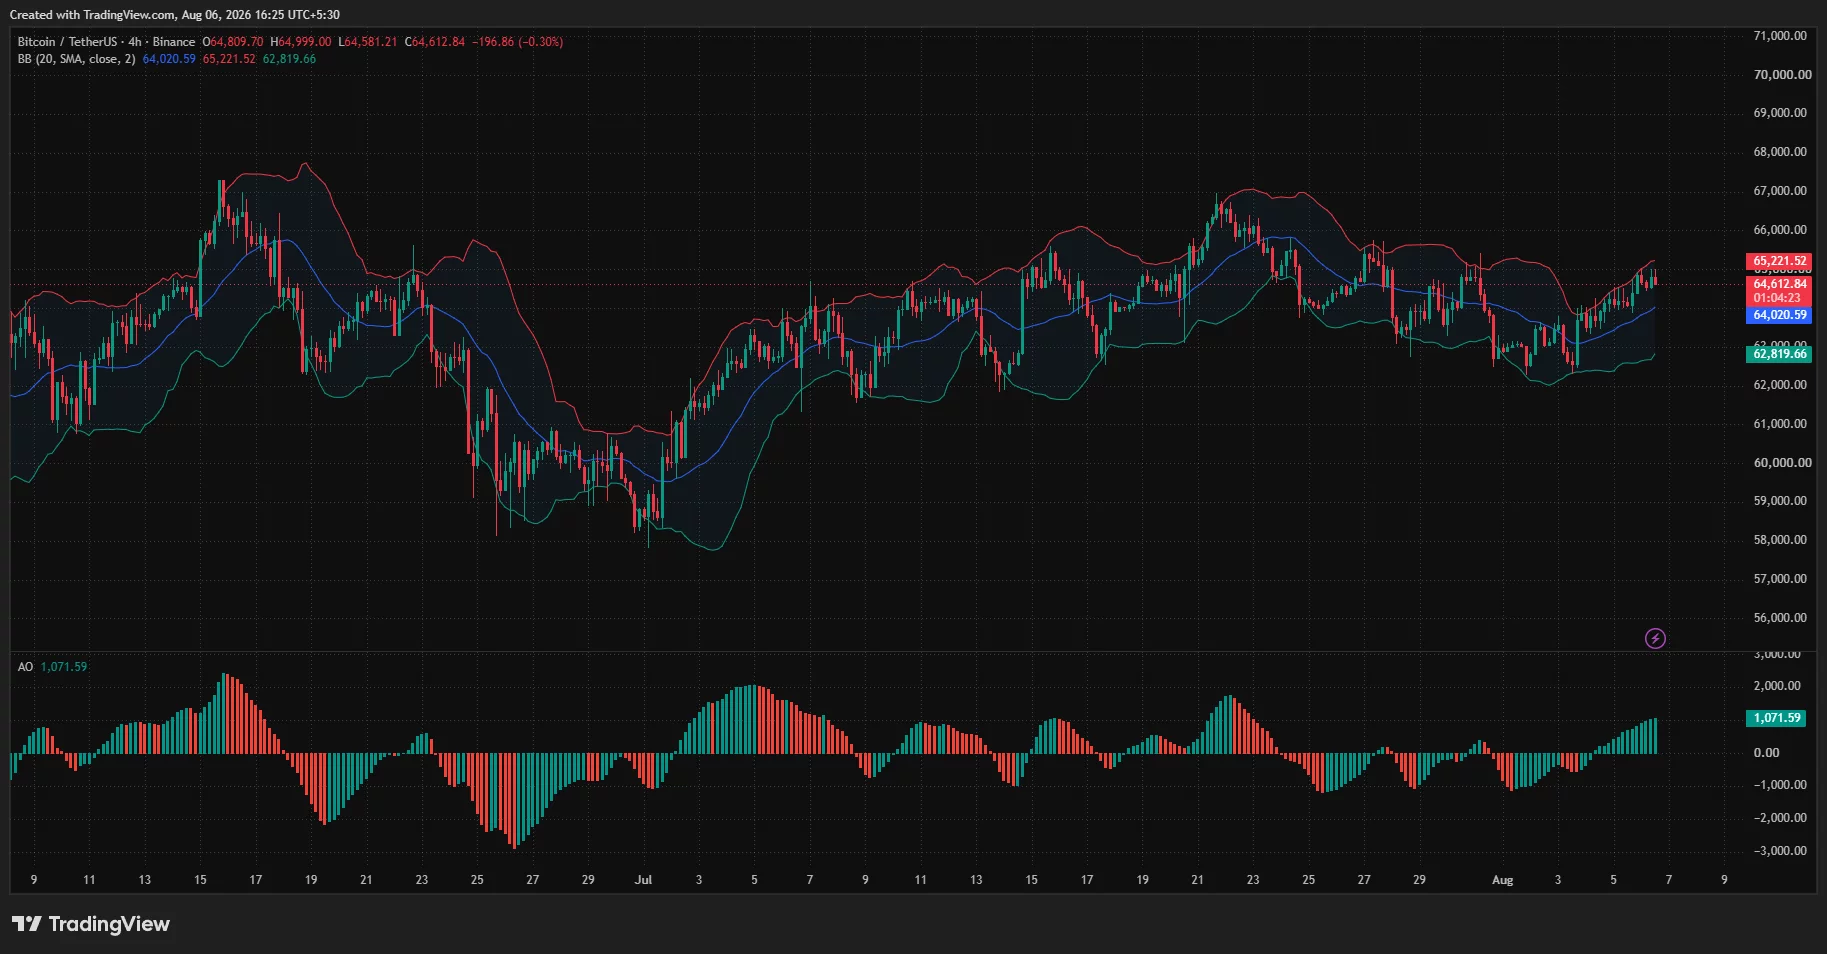
The Awesome Oscillator has climbed to 1,071 and is printing expanding green bars. This suggests that bullish momentum is strengthening despite Bitcoin’s small rejection from the intraday high.
A 4-hour close above $65,220 could confirm a Bollinger Band breakout. Bitcoin would then face previous swing resistance around $66,000 before challenging the $67,000–$68,000 region.
However, a rejection could pull the price back toward the middle band at $64,020. The lower band near $62,819 represents a wider invalidation area for the short-term recovery.
The daily chart presents a more cautious picture. Bitcoin has reclaimed the 23.6% Fibonacci retracement at $63,715, calculated from the February low of $57,815 to the May high of $82,816.

Daily RSI has risen to 52.96 and remains above its signal average of 49.46. The reading supports mild bullish momentum without placing Bitcoin in overbought territory.
MACD remains less convincing. The MACD line sits at 25.31, below the 29.83 signal line, while the histogram is slightly negative at minus 4.51. The narrow gap suggests bearish momentum is fading, but a confirmed bullish crossover has not occurred.
Liquidation heatmap puts $65,500 in focus
CoinGlass’ 3-day liquidation heatmap shows a dense concentration of leveraged positions immediately above Bitcoin’s current price. Liquidity is clustered between approximately $65,000 and $65,500, with additional pockets extending toward $66,000.

A move through this area could liquidate short positions and accelerate the breakout. This potential short squeeze may explain why traders are watching for a sweep above $65,000 before deciding whether the recovery can continue.
The heatmap also shows major downside liquidity around $63,700–$63,900 and $63,000–$63,200. These zones could attract price if buyers fail to hold $64,000.
The $63,715 Fibonacci level aligns closely with the first downside liquidation cluster. Its loss would expose $63,000, followed by the 4-hour lower Bollinger Band around $62,819.
Below that point, attention would return to the Aug. 3 recovery zone and the daily range floor near $60,000. A break beneath $60,000 would invalidate the current sequence of higher short-term lows.
Analysts identify $68,000 as the breakout target
Analyst Ted Pillows identified $65,000 as Bitcoin’s immediate resistance and said reclaiming it could open the next leg higher.
“BTC is right at its $65,000 resistance zone. Reclaim this, and Bitcoin could rally towards $68,000 next.”
His chart places further resistance around $67,400 and $69,700, broadly aligning with the daily Fibonacci resistance at $67,365.
Trader Lennaert Snyder also pointed to $65,000 as the key test after a 4-hour close above $64,000 triggered the latest advance. However, he warned that price is high within its recent range and could first sweep liquidity above $65,000 or the prior weekly high near $65,400.
The combined charts leave Bitcoin at a decision point. Holding above $63,715 keeps the recovery intact, while a close above $65,220 would strengthen the case for $67,365 and $68,000. Failure to clear resistance would return focus to the liquidity pools near $63,700 and $63,000.
US market context remains a key catalyst
For U.S. investors, Bitcoin’s next move may depend partly on Wall Street risk appetite and incoming Federal Reserve signals. U.S. equity futures were mixed on Aug. 6, with semiconductor weakness offsetting gains among several large technology companies.
Progress on the Hormuz negotiations could lower energy-related inflation risks and help risk assets. Renewed geopolitical tension, higher oil prices or hawkish Fed expectations would instead increase the probability of another Bitcoin rejection near $65,000.
Disclosure: This article does not represent investment advice. The content and materials featured on this page are for educational purposes only.


Be the first to comment