


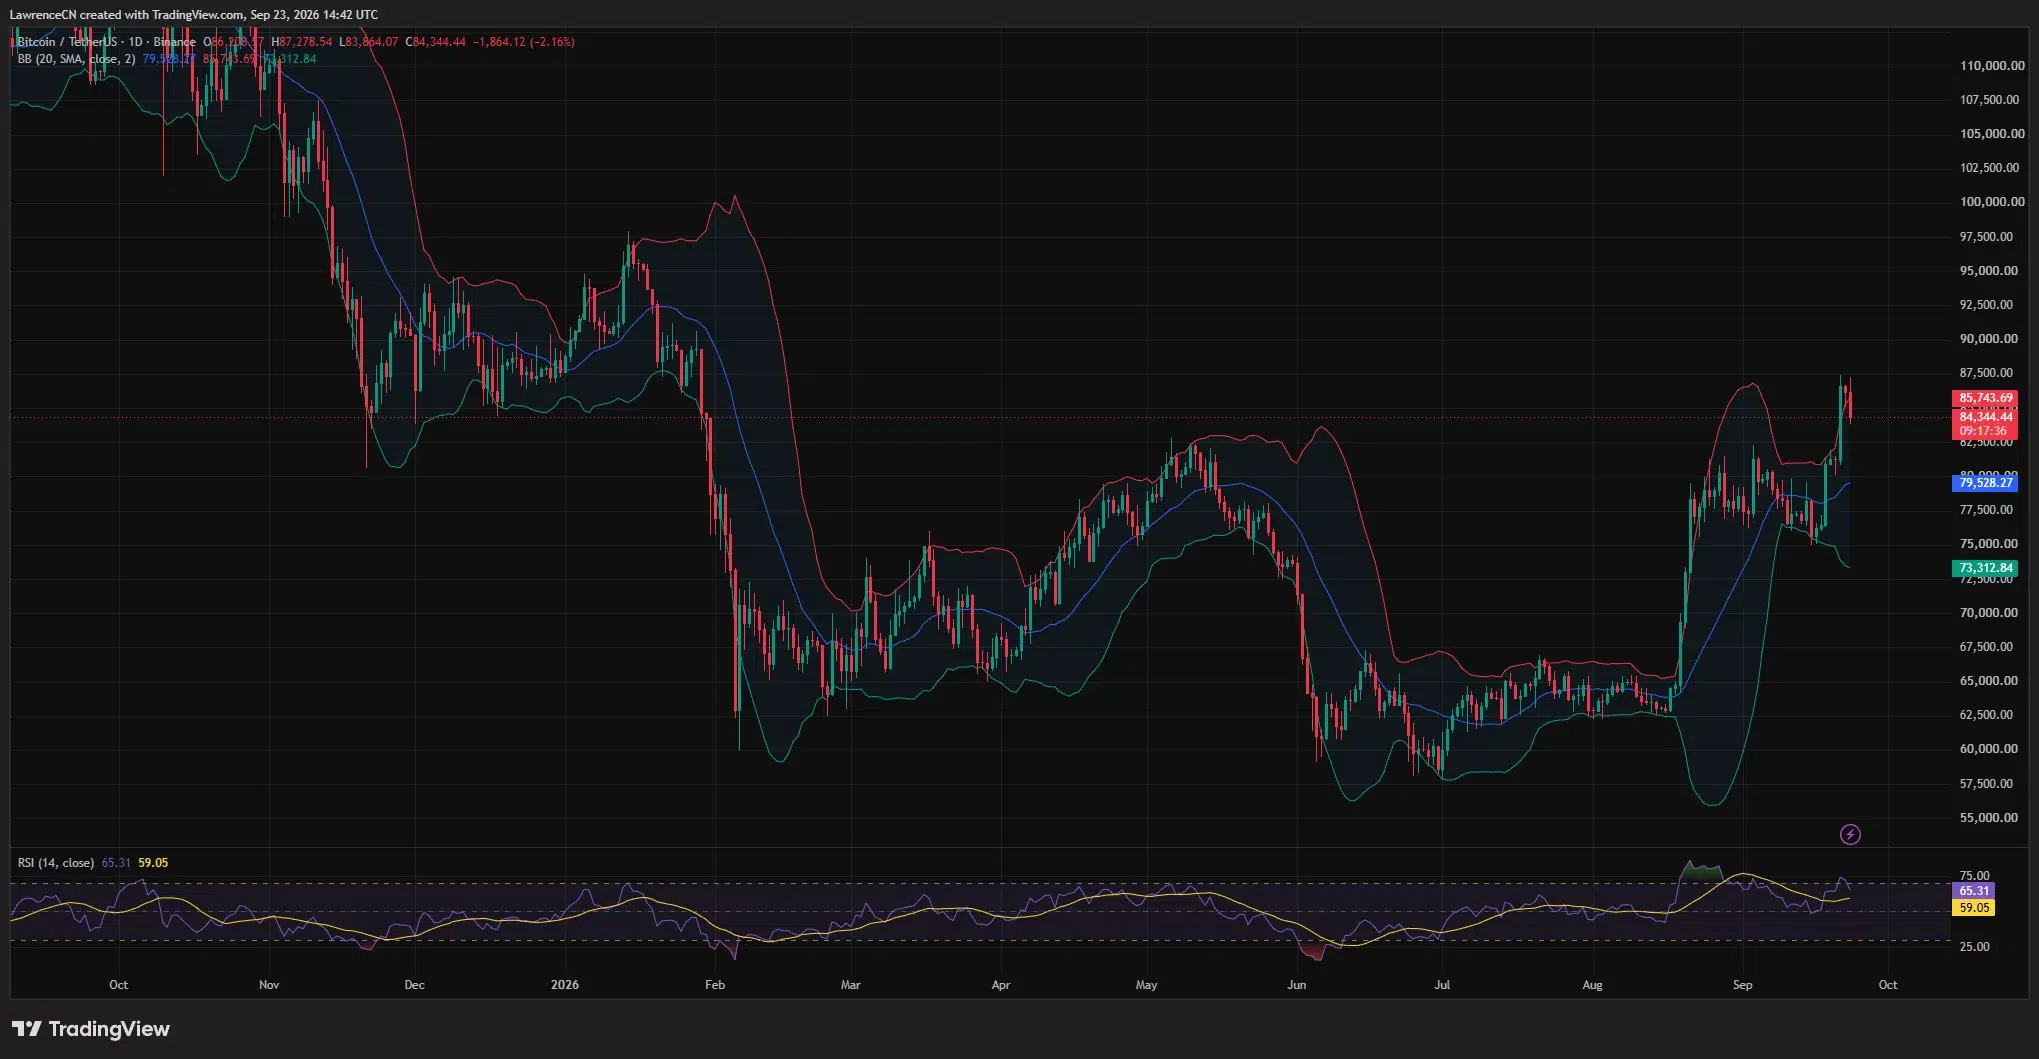
Bitcoin price fell below $85,000 on Sep. 23 after briefly trading above $87,000, as a rally driven partly by short liquidations lost momentum. The daily chart showed BTC near $84,344, down 2.16% for the session.
Summary
- Bitcoin price retreated from a daily high near $87,279 to about $84,344 on the daily chart.
- The daily RSI stood at 65.31, while the 4-hour Supertrend support sat near $83,593.
- CoinMarketCap’s Alice Liu said short covering, rather than new buying, drove much of the rise.
- US spot Bitcoin ETFs drew $999 million on Sep. 21, according to Farside Investors.
Bitcoin price pulls back after testing $87K
The daily chart shows Bitcoin (BTC) price reaching $87,278.54 before falling to about $84,344. The move took price back below the chart’s $85,743.69 upper Bollinger Band after a sharp climb from mid-September lows near $75,000.

The 4-hour chart captures the latest pullback more clearly. Its current candle fell from an open near $85,650 to roughly $84,329, with a low around $83,864. Price remained above the 4-hour Supertrend line at $83,592.86, though the drop brought that level back into view.
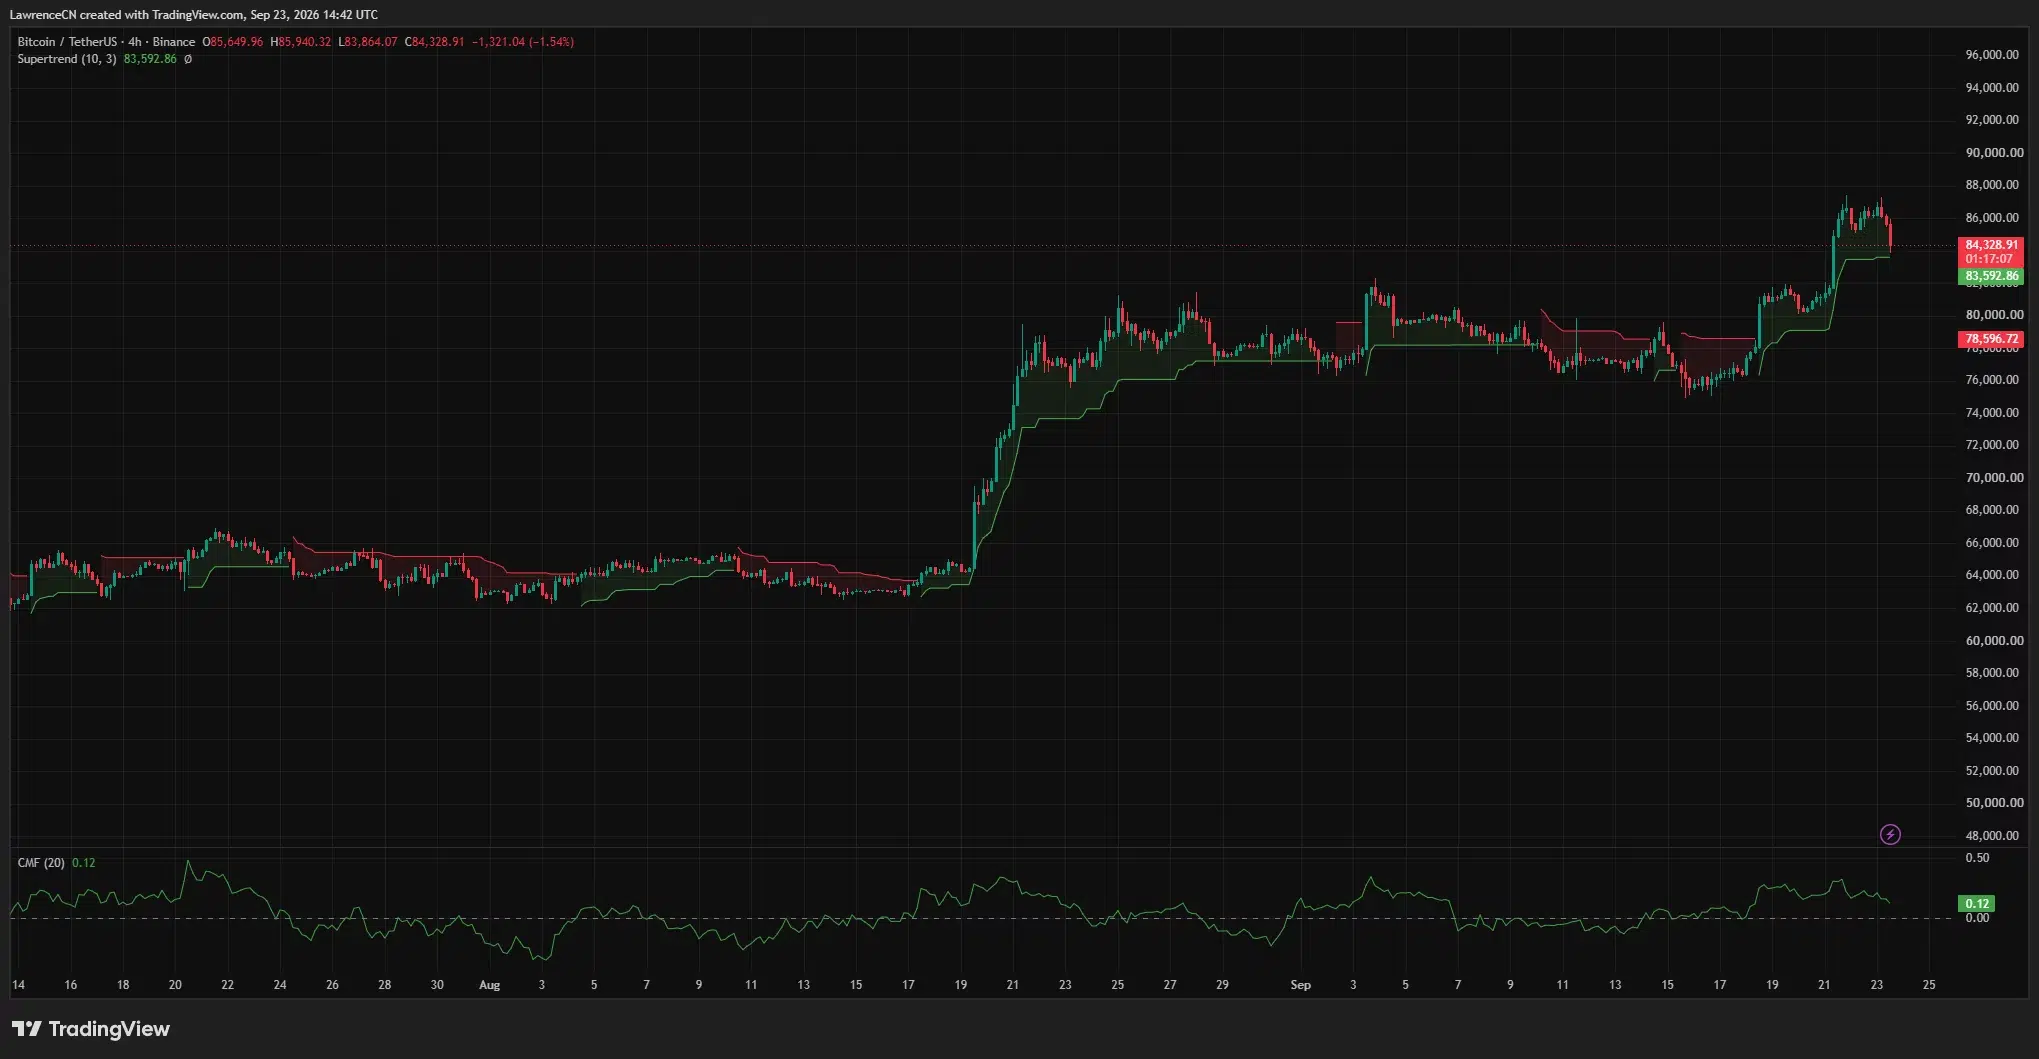
Bitcoin’s daily relative strength index, or RSI, stood at 65.31. A reading above 50 shows that recent gains still outweigh recent losses, but the indicator had eased after approaching the 70 level earlier in the rally. On the 4-hour chart, the Chaikin Money Flow indicator remained positive at 0.12, suggesting buying pressure had not fully disappeared as price pulled back.
The charts therefore show a pause in a strong advance, with the immediate test shifting from whether Bitcoin can extend its breakout to whether buyers defend the levels gained this week.
Short covering helped drive the rally
Alice Liu, head of research at CoinMarketCap, noted that the climb toward $87,000 reflected traders closing bearish positions. She said Monday’s forced short covering was roughly ten times the value of long liquidations, while total liquidations had fallen to half their 30-day average by Tuesday.
“Bitcoin’s move to $87,000 was not a wave of new buying, it was the unwinding of bearish positioning. The fuel is behind us, not ahead.”
Liu’s assessment points to a question for the next leg of the move: whether spot buyers can sustain prices once forced purchases from closing short positions subside. A CryptoQuant chart shows futures demand improving while its measure of spot demand remains below zero. The chart supports a distinction between stronger derivatives activity and confirmed spot buying; it does not, on its own, establish where price will go next.
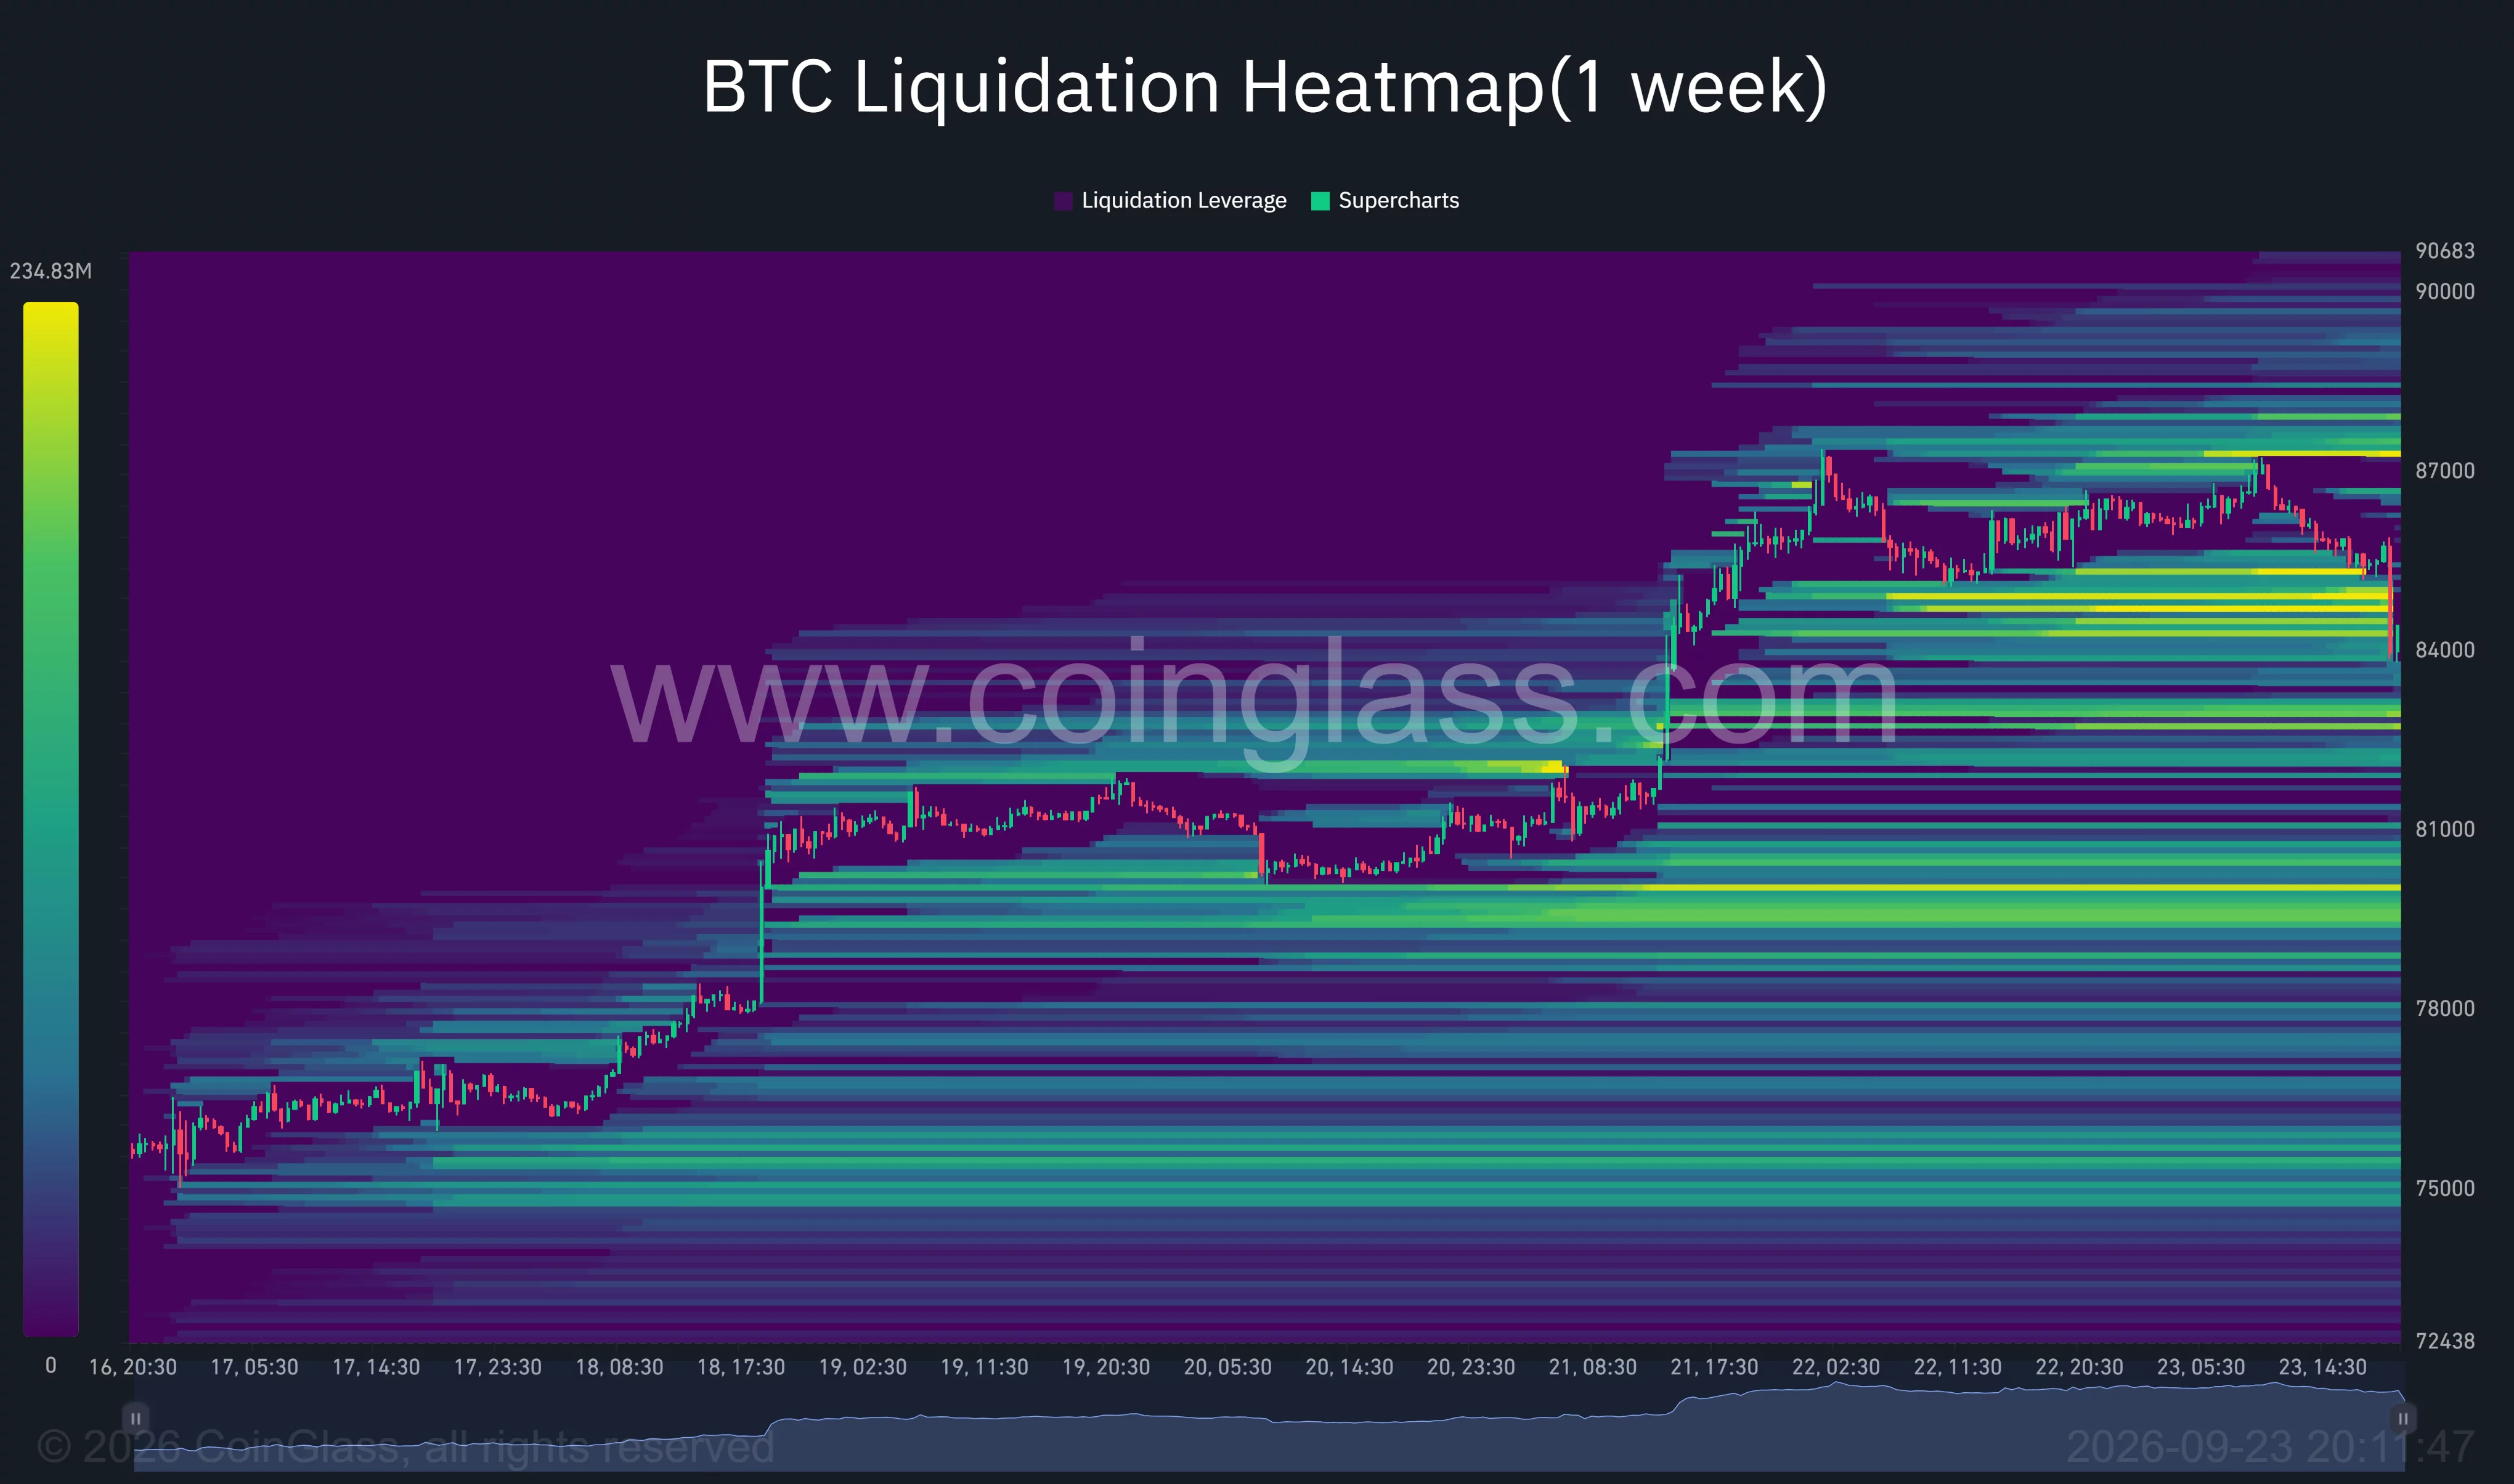
The one-week CoinGlass liquidation heatmap shows a bright band around $84,500 to $85,000 near the latest price action. Another concentration lies around $82,500 to $83,000, with a separate band near $87,000 to $87,500 above. Those bands mark estimated areas of leveraged positions that could face liquidation if price reaches them, rather than firm support or resistance.
Bitcoin’s $83,600 support faces a short-term test
The 4-hour Supertrend at about $83,593 is the closest marked technical level below price. Holding above it would leave Bitcoin within the recent upward 4-hour trend. A sustained move below it would put the $82,500 to $83,000 area shown on the CoinGlass heatmap in focus.
Ardi, an analyst, said Bitcoin had lost the $85,000 base of a 4-hour bull flag and identified $81,000 to $83,000 as the next liquidity area. The daily chart places its 20-day Bollinger Band midpoint lower, near $79,528, showing how far Bitcoin has moved above its recent daily average.
On the upside, buyers would first need to reclaim $85,000 and then the recent high near $87,279. The CoinGlass heatmap shows estimated liquidation liquidity around $87,000 to $87,500, close to that high. A move through the area would need to hold to establish whether the rally has regained momentum.
Neither the heatmap nor the indicators guarantee a move toward any particular level. They identify where the current pullback may test the trend and where leveraged positions appear concentrated.
Analysts differ on Bitcoin’s staying power
Tony Dicarlo, director of institutional propositions at RootstockLabs, told crypto.news that Bitcoin had moved back above its 50-week and 200-week moving averages and risen about 29% over 35 days. He linked the broader recovery to US policy developments, macro conditions and demand through spot Bitcoin ETFs.
Dicarlo said the SEC’s tokenized securities proposal and a House committee’s progress on the American Reserve Modernization Act had helped confidence. The House Financial Services Committee voted 28–21 on Sep. 16 to advance the reserve bill; it would still need to pass both chambers before becoming law.
“Looking ahead, I’m not calling winter over outright, but with the bad news now largely priced in, a confluence of good news, regulatory, legislative and macro, is helping bitcoin build higher.”
Liu’s shorter-term reading is more cautious. Her liquidation figures suggest that a source of automatic buying has faded, even as Dicarlo sees support from policy developments and fund flows. The two views turn on different evidence: what powered the move to $87,000 and what could support Bitcoin after the squeeze.
US ETF inflows provide a test of spot demand
US-listed spot Bitcoin ETFs recorded $999 million in net inflows on Sep. 21, according to Farside Investors. The figure measures demand for the funds on that trading day; it should not be treated as the Sep. 23 flow or as proof that buyers will defend the current price.
For US investors, the next ETF reports offer a way to check whether fund demand continues as Bitcoin pulls back. The nearer price test is $83,593 on the 4-hour chart. A hold there would keep the recent rise intact on that indicator, while a break would bring the lower liquidity band into view.
Disclosure: This article does not represent investment advice. The content and materials featured on this page are for educational purposes only.


Be the first to comment