



The Bitcoin price failed to break out once again and suffered a dip on Tuesday, pulling back 3.5% – equivalent to around $3,000. Oil rose slightly, but could not shake off the current downtrend. The U.S. 10-year bond yield is still very high at 5.3%, but the indications are it may be starting to roll over and soften back to 5% in the short to medium term.
Oil price to fall out of its channel?
Source: TradingView

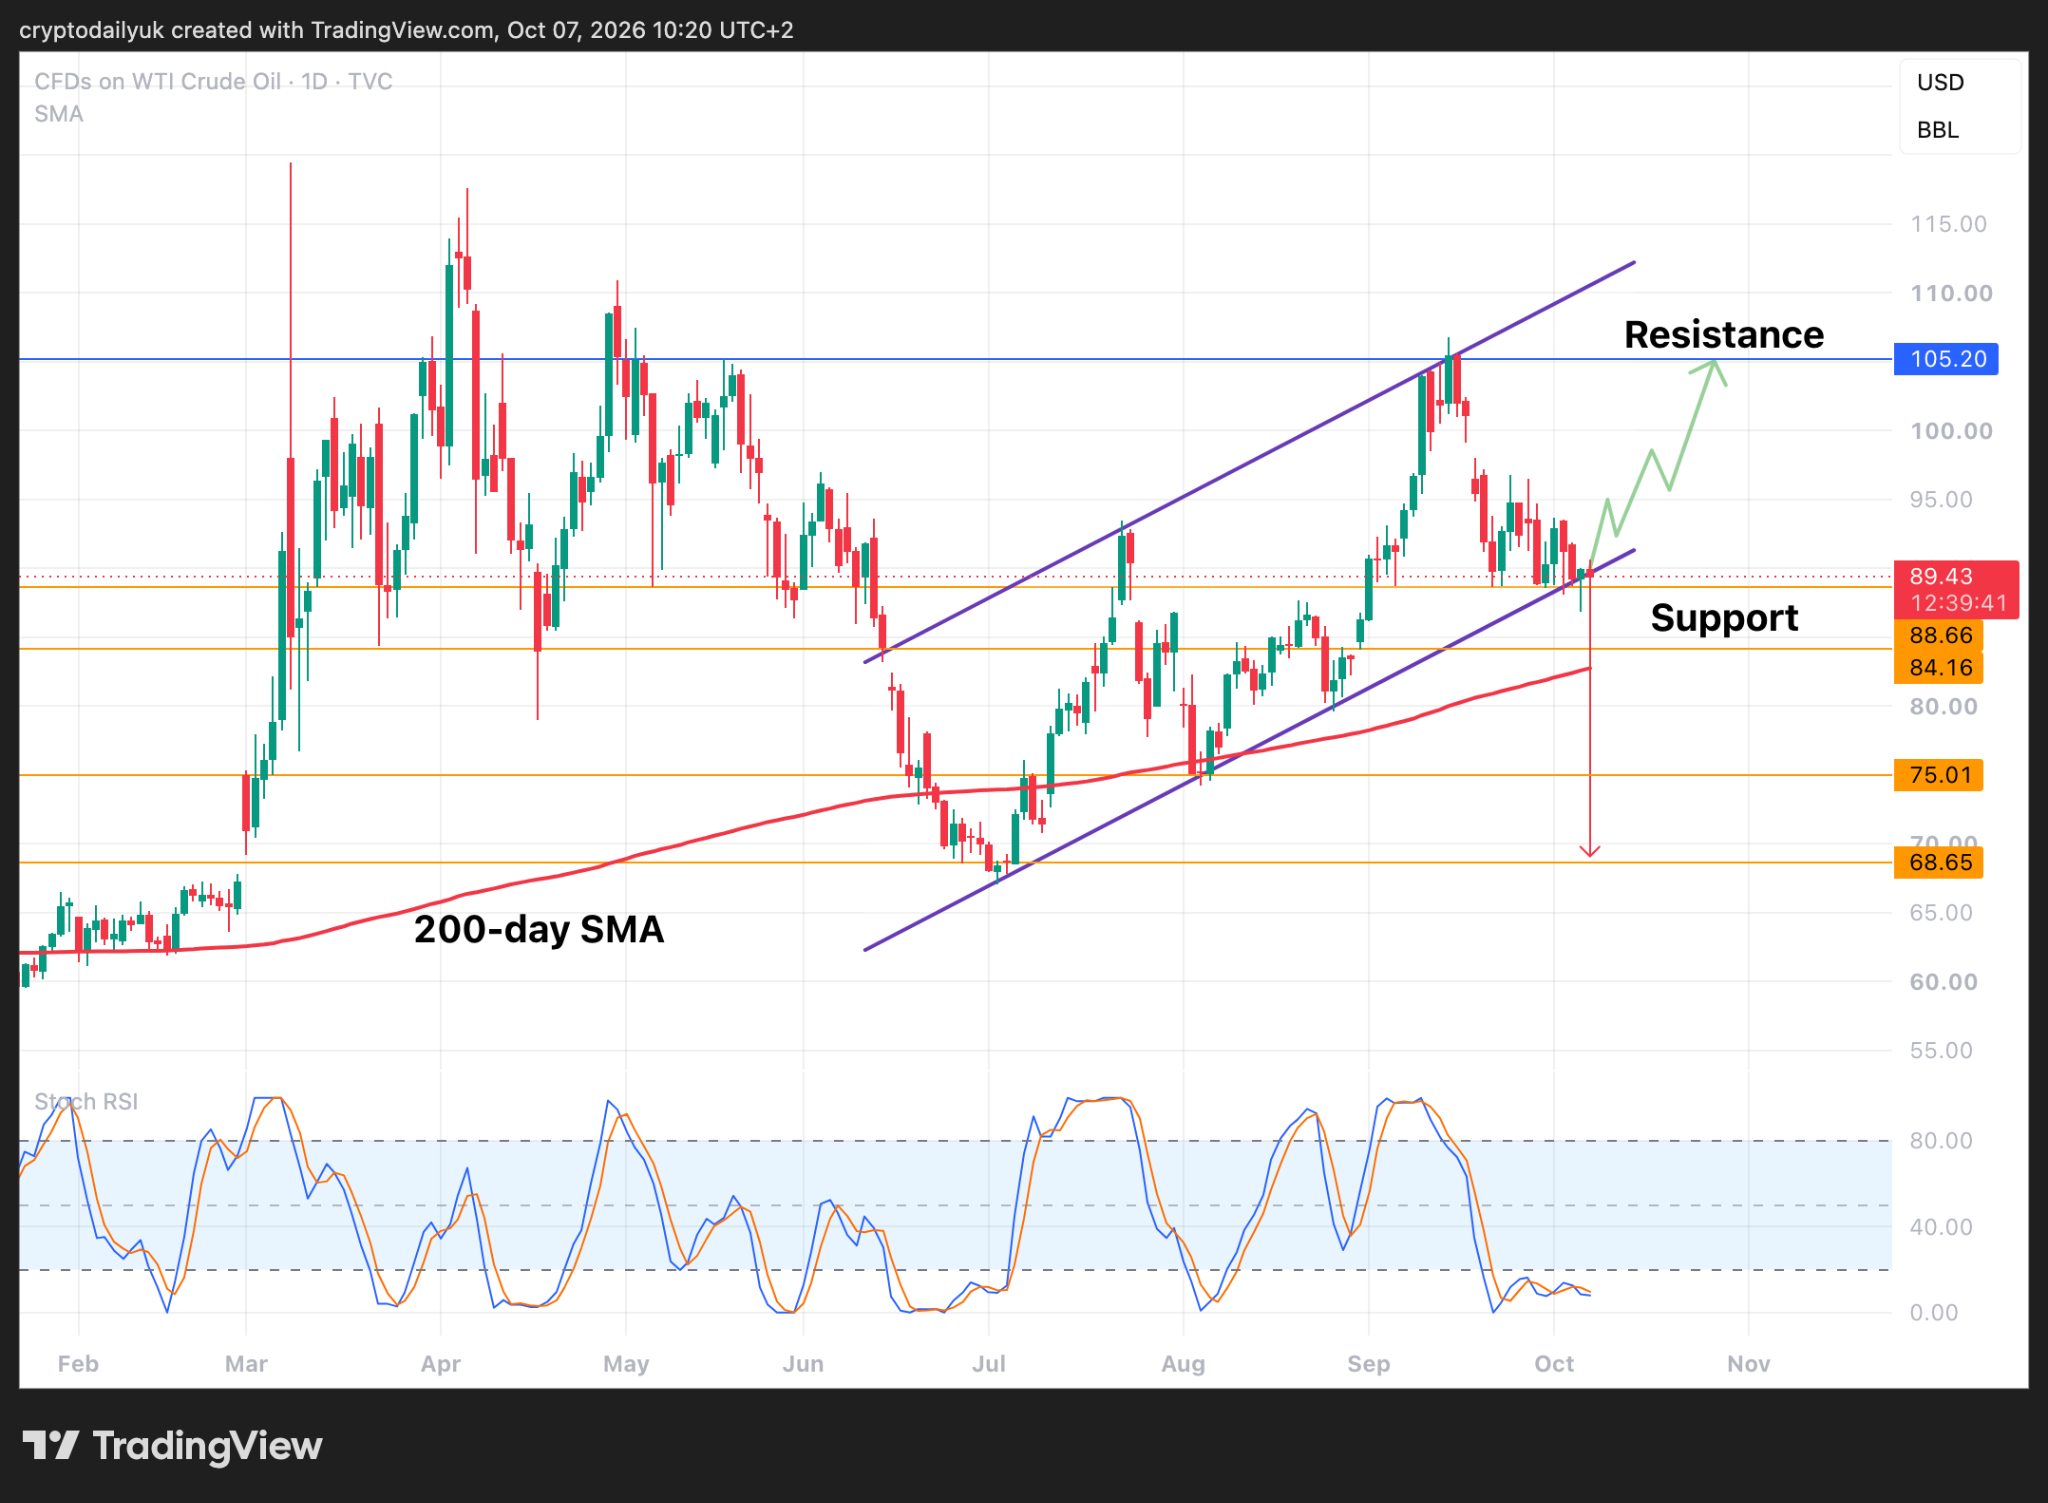
WTI Crude Oil is at a critical juncture. On Tuesday the price fell through the bottom of the ascending channel formation, but managed to recover by the end of the day. It’s more likely than not that this pattern does break to the downside, and therefore it’s good to conjecture where the oil price will fall to.
The first horizontal support is at $84, and it can be seen that the 200-day SMA is also approaching this point. This moving average would bolster the horizontal support, but if these break to the downside we are looking at a fall to $75 and very possibly $68, which also happens to mark the full measured move out of the channel.
If oil bounces from its current level it could reach $93, with an outside possibility of $105, which will definitely depend on how the US/Iran conflict unfolds.
$BTC price dumps – more downside or bounce?
Source: TradingView
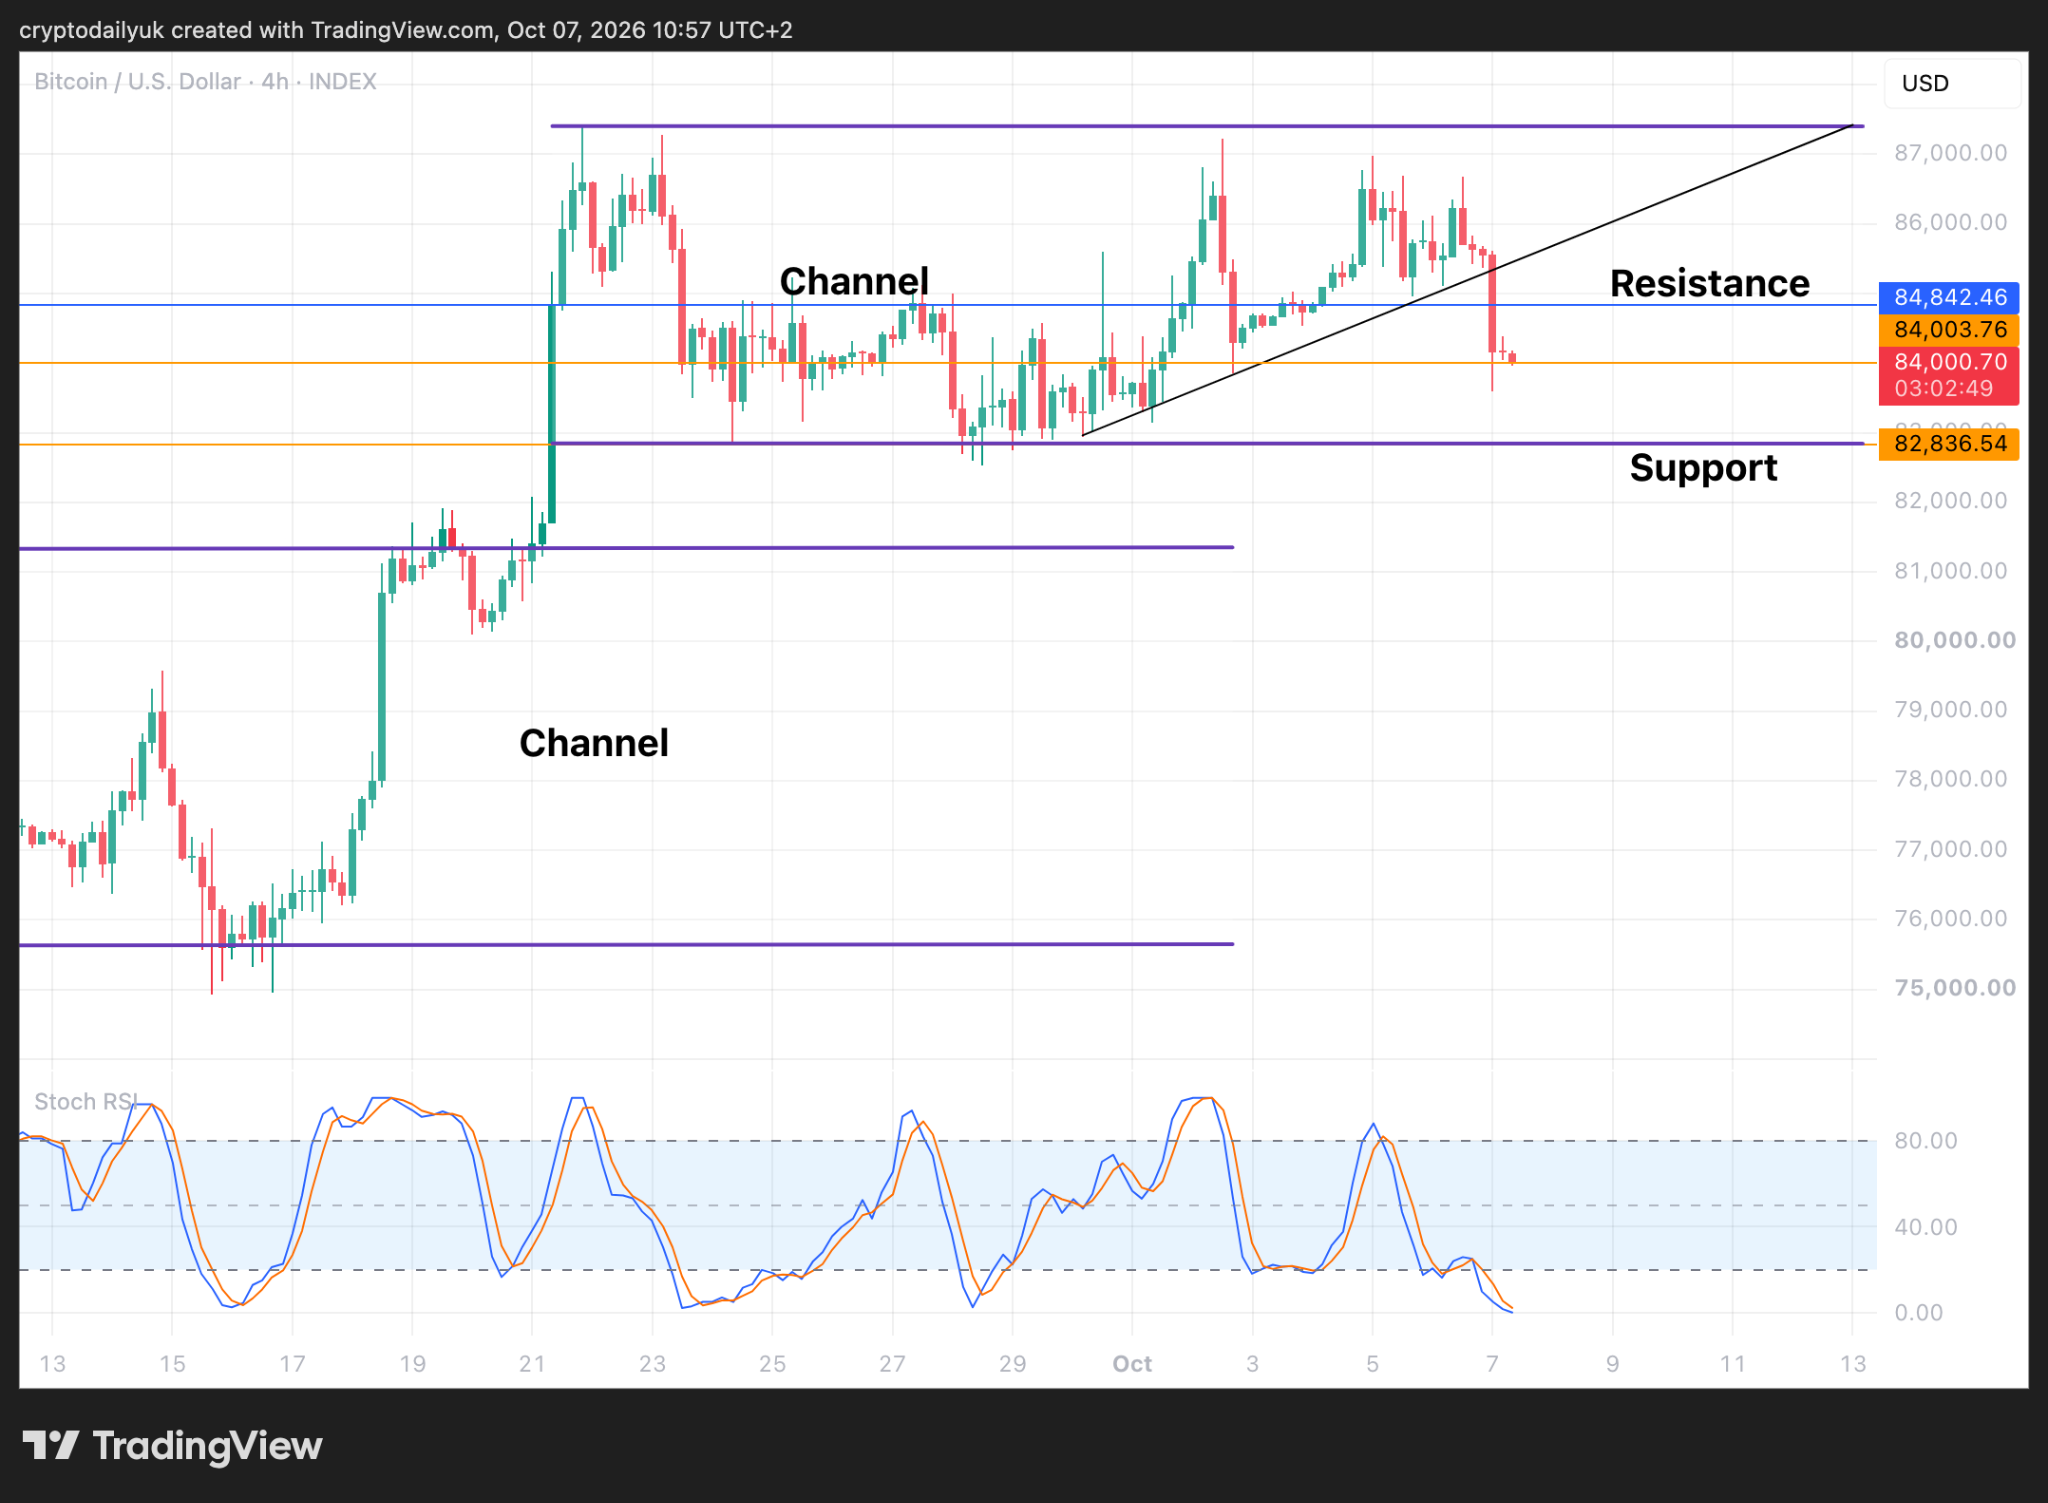
The 4-hour chart shows that dump down below the ascending trendline. This is the same trendline that was supposed to guide the $BTC price up to the top of the channel and a breakout. It wasn’t to be. It could be the case that more time is needed for the last big upside move to be digested, therefore the sideways chop may be set to continue until a more appropriate time is reached. That, or the price will break down out of the channel.
The $BTC price is currently sitting on fairly strong support at $84K. If this fails it will likely be that the price carries on falling to the bottom of the channel, which would then become a critical hold.
As things stand, things are still bullish. The Stochastic RSI indicators have reached bottom in this time frame and so upside price momentum could be about to return.
Is $73K a possible big move target to the downside?
Source: TradingView
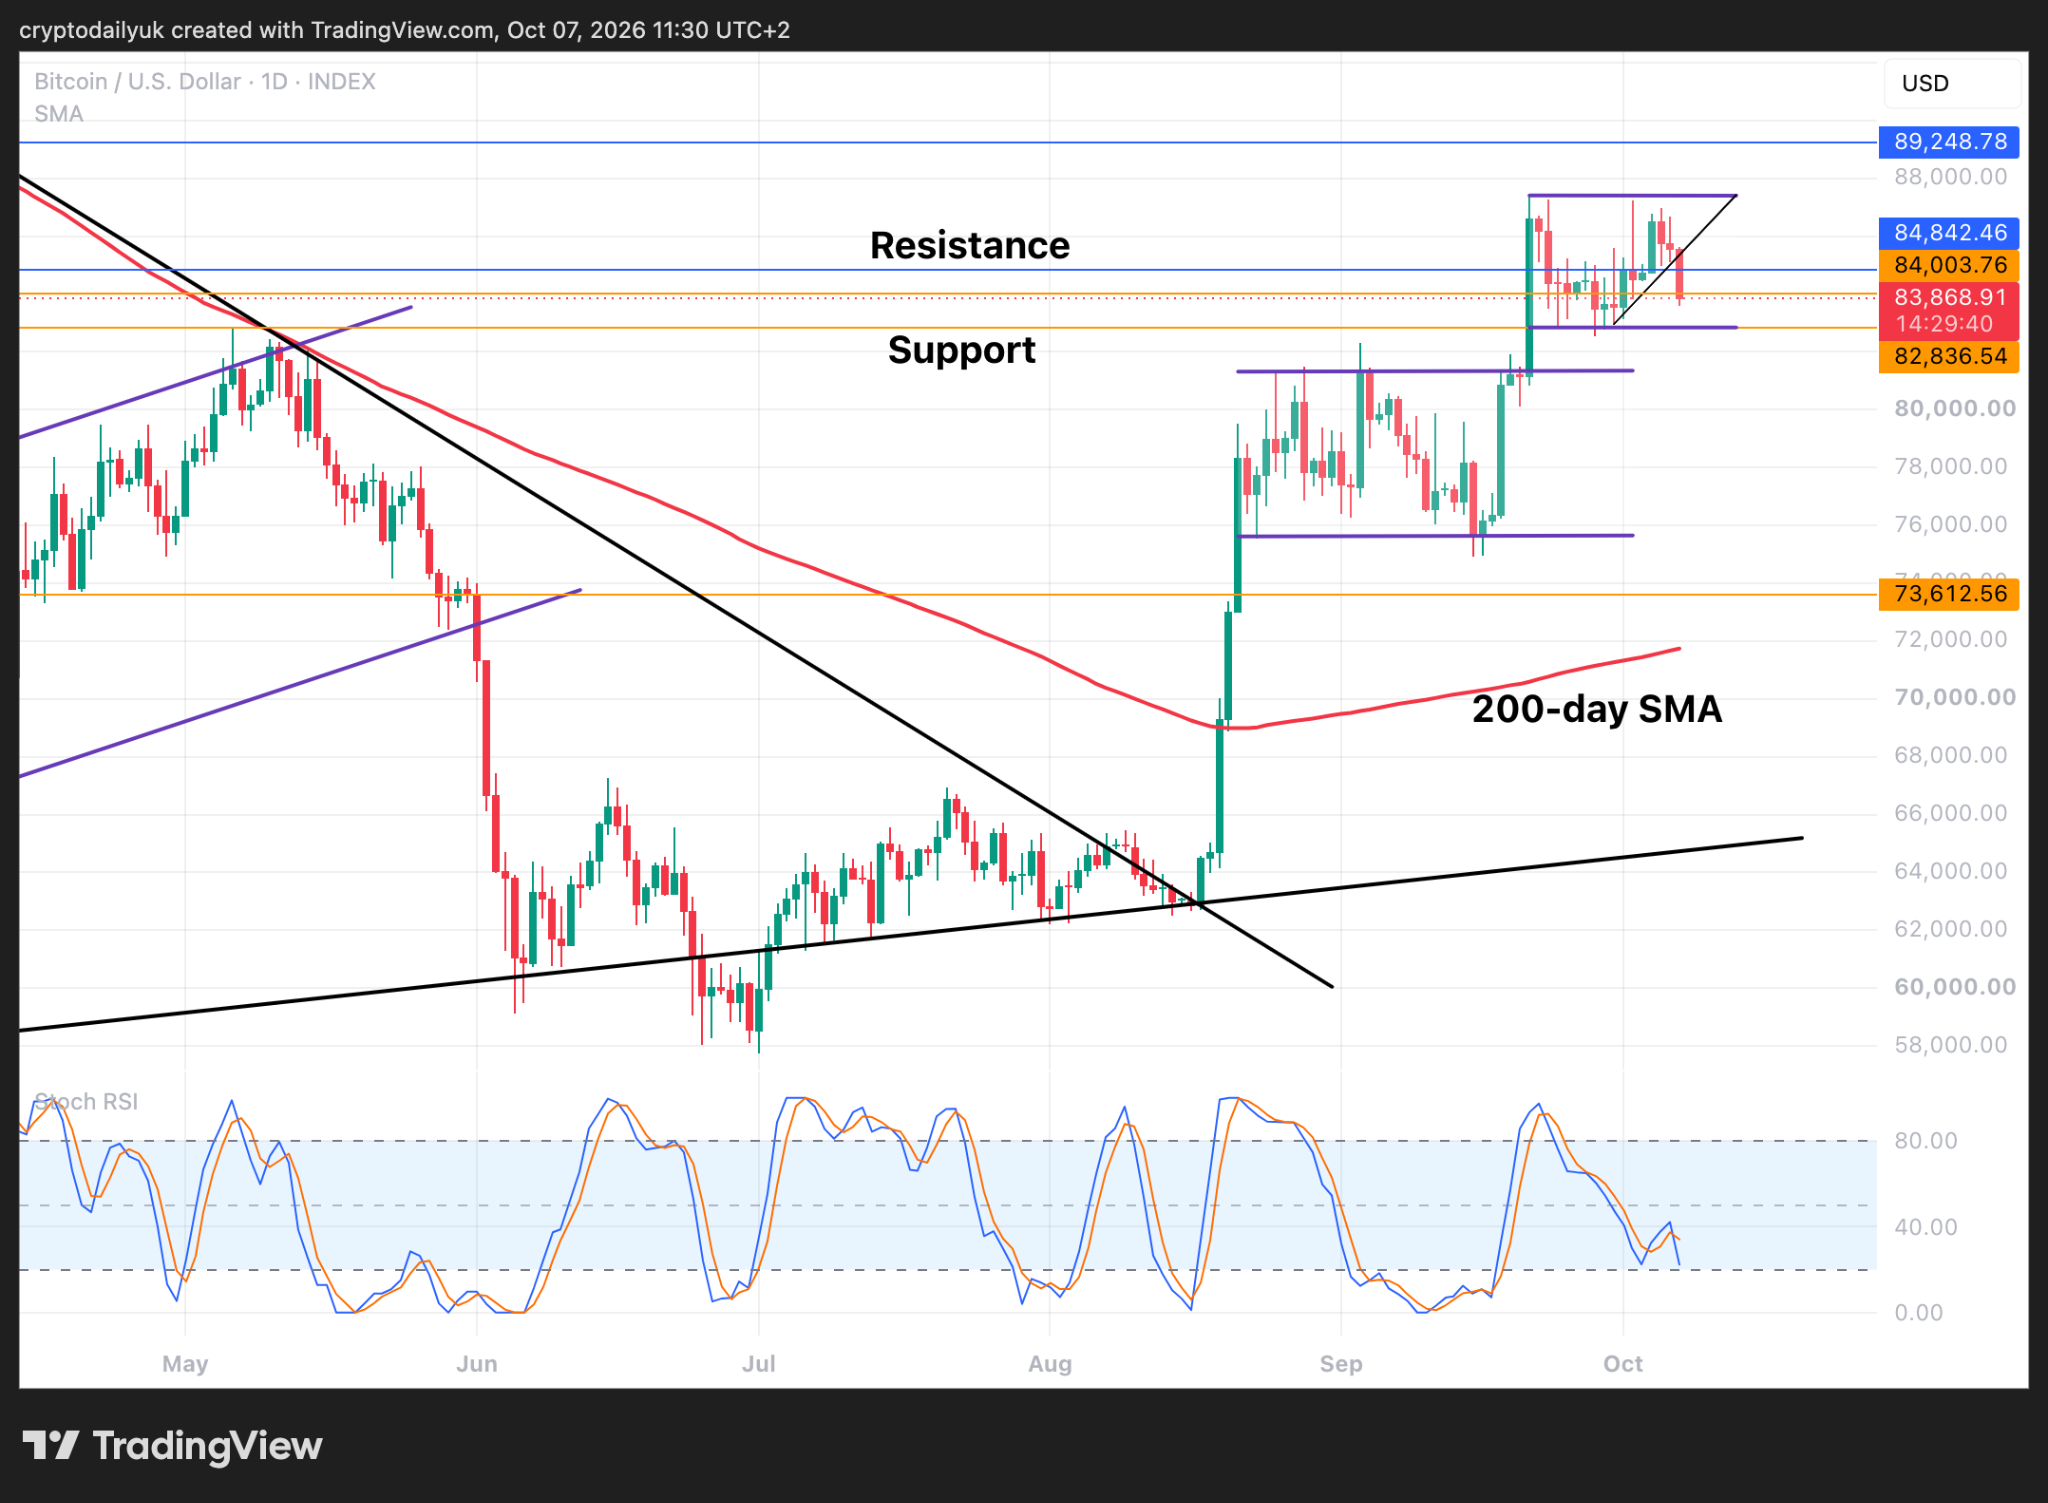
Out into the daily time frame it can be imagined that there now is a reasonable chance that the $BTC price does fall to the bottom of the small channel, that said, with bullish-tinted spectacles on, this could be one more healthy retest of the channel bottom before a last rise to the top of the channel and a breakout.
Taking those particular glasses off, a failure of the horizontal support at the bottom of the channel could lead to the first big move down. How far is anyone’s guess, but the 200-day simple moving average (SMA) is climbing well below the price action. Could it be that the price action comes all the way down to retest this SMA, and specifically as it comes in line with the very important $73,600 horizontal support level? That would be a nearly 16% correction from the top and would respect support structures perfectly.
A potential retest of the 50-week SMA?
Source: TradingView
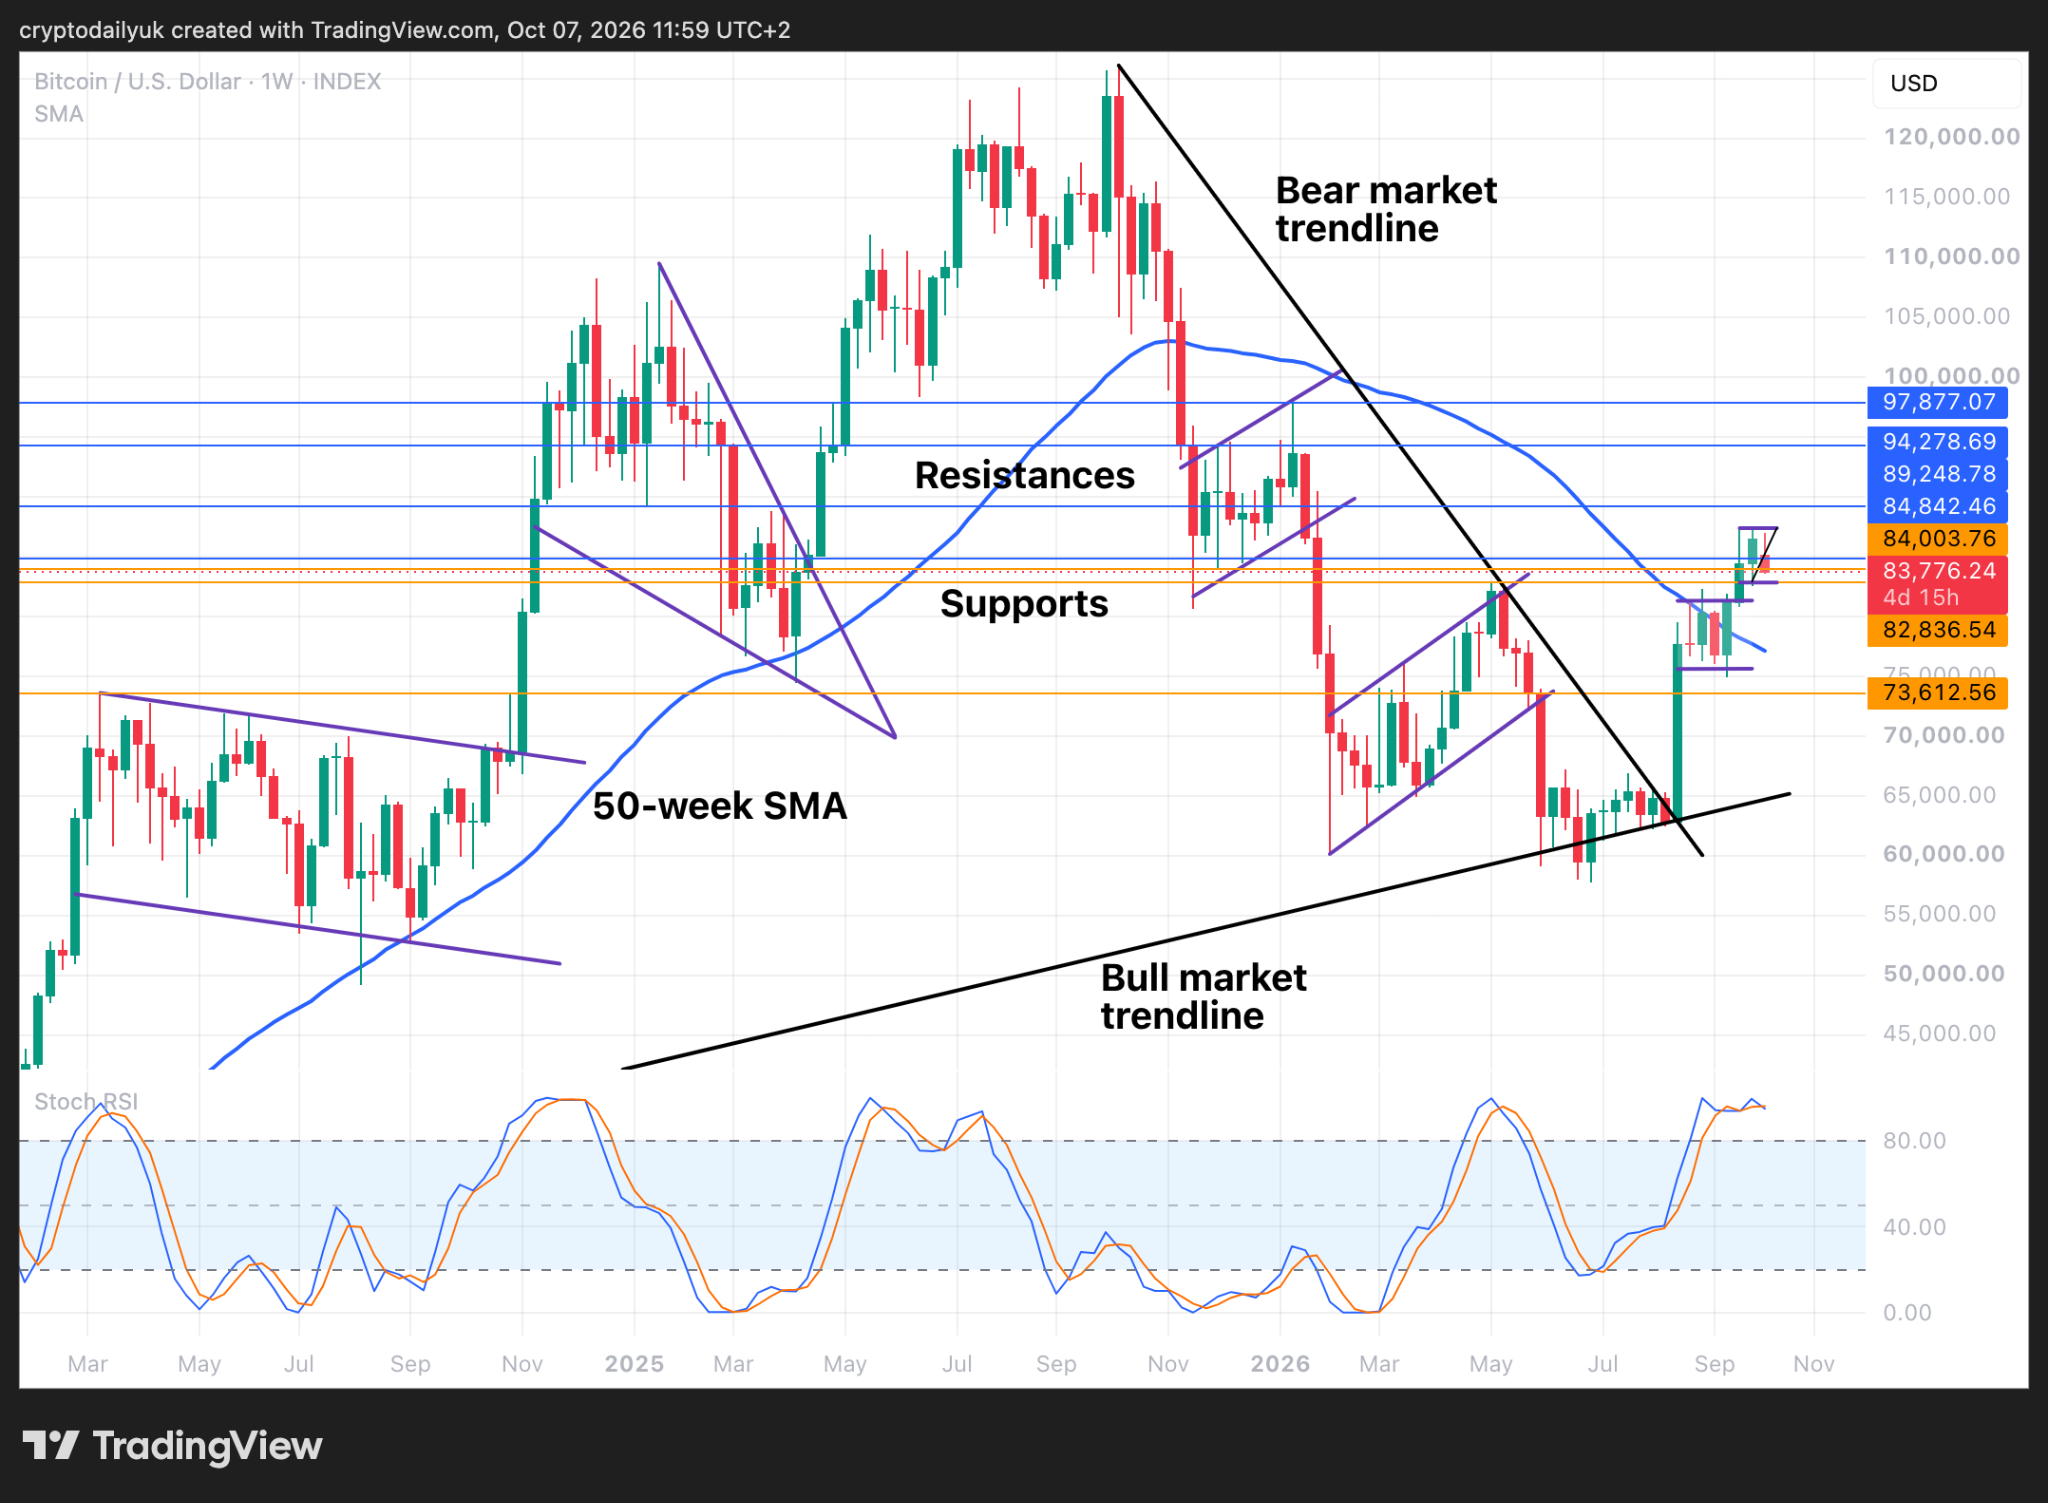
In the weekly time frame we are left wondering if the 50-week SMA will play another important role? Breaking up and through this SMA was a major sign of a new bull market. It can be seen in the last bear market that this SMA was major support throughout. Could it be that as this moving average dips to around $73K, it becomes support for the $BTC price as it potentially corrects down to this level?
The Stochastic RSI indicators are another sign that this first big rally may have run to its top. The indicators are going to have to come back down at some point, and it’s at this point that that is looking quite likely.
Disclaimer: This article is provided for informational purposes only. It is not offered or intended to be used as legal, tax, investment, financial, or other advice.





Be the first to comment