



A rising channel pattern has emerged for the Bitcoin price, capable of guiding the king of the cryptocurrencies back to $100K. Can the bulls succeed in keeping the $BTC price within the channel, or are the bears already planning a breakdown that could sink the price down to the low $70K level?
Small trendline break to the upside or main channel breakdown?
Source: TradingView

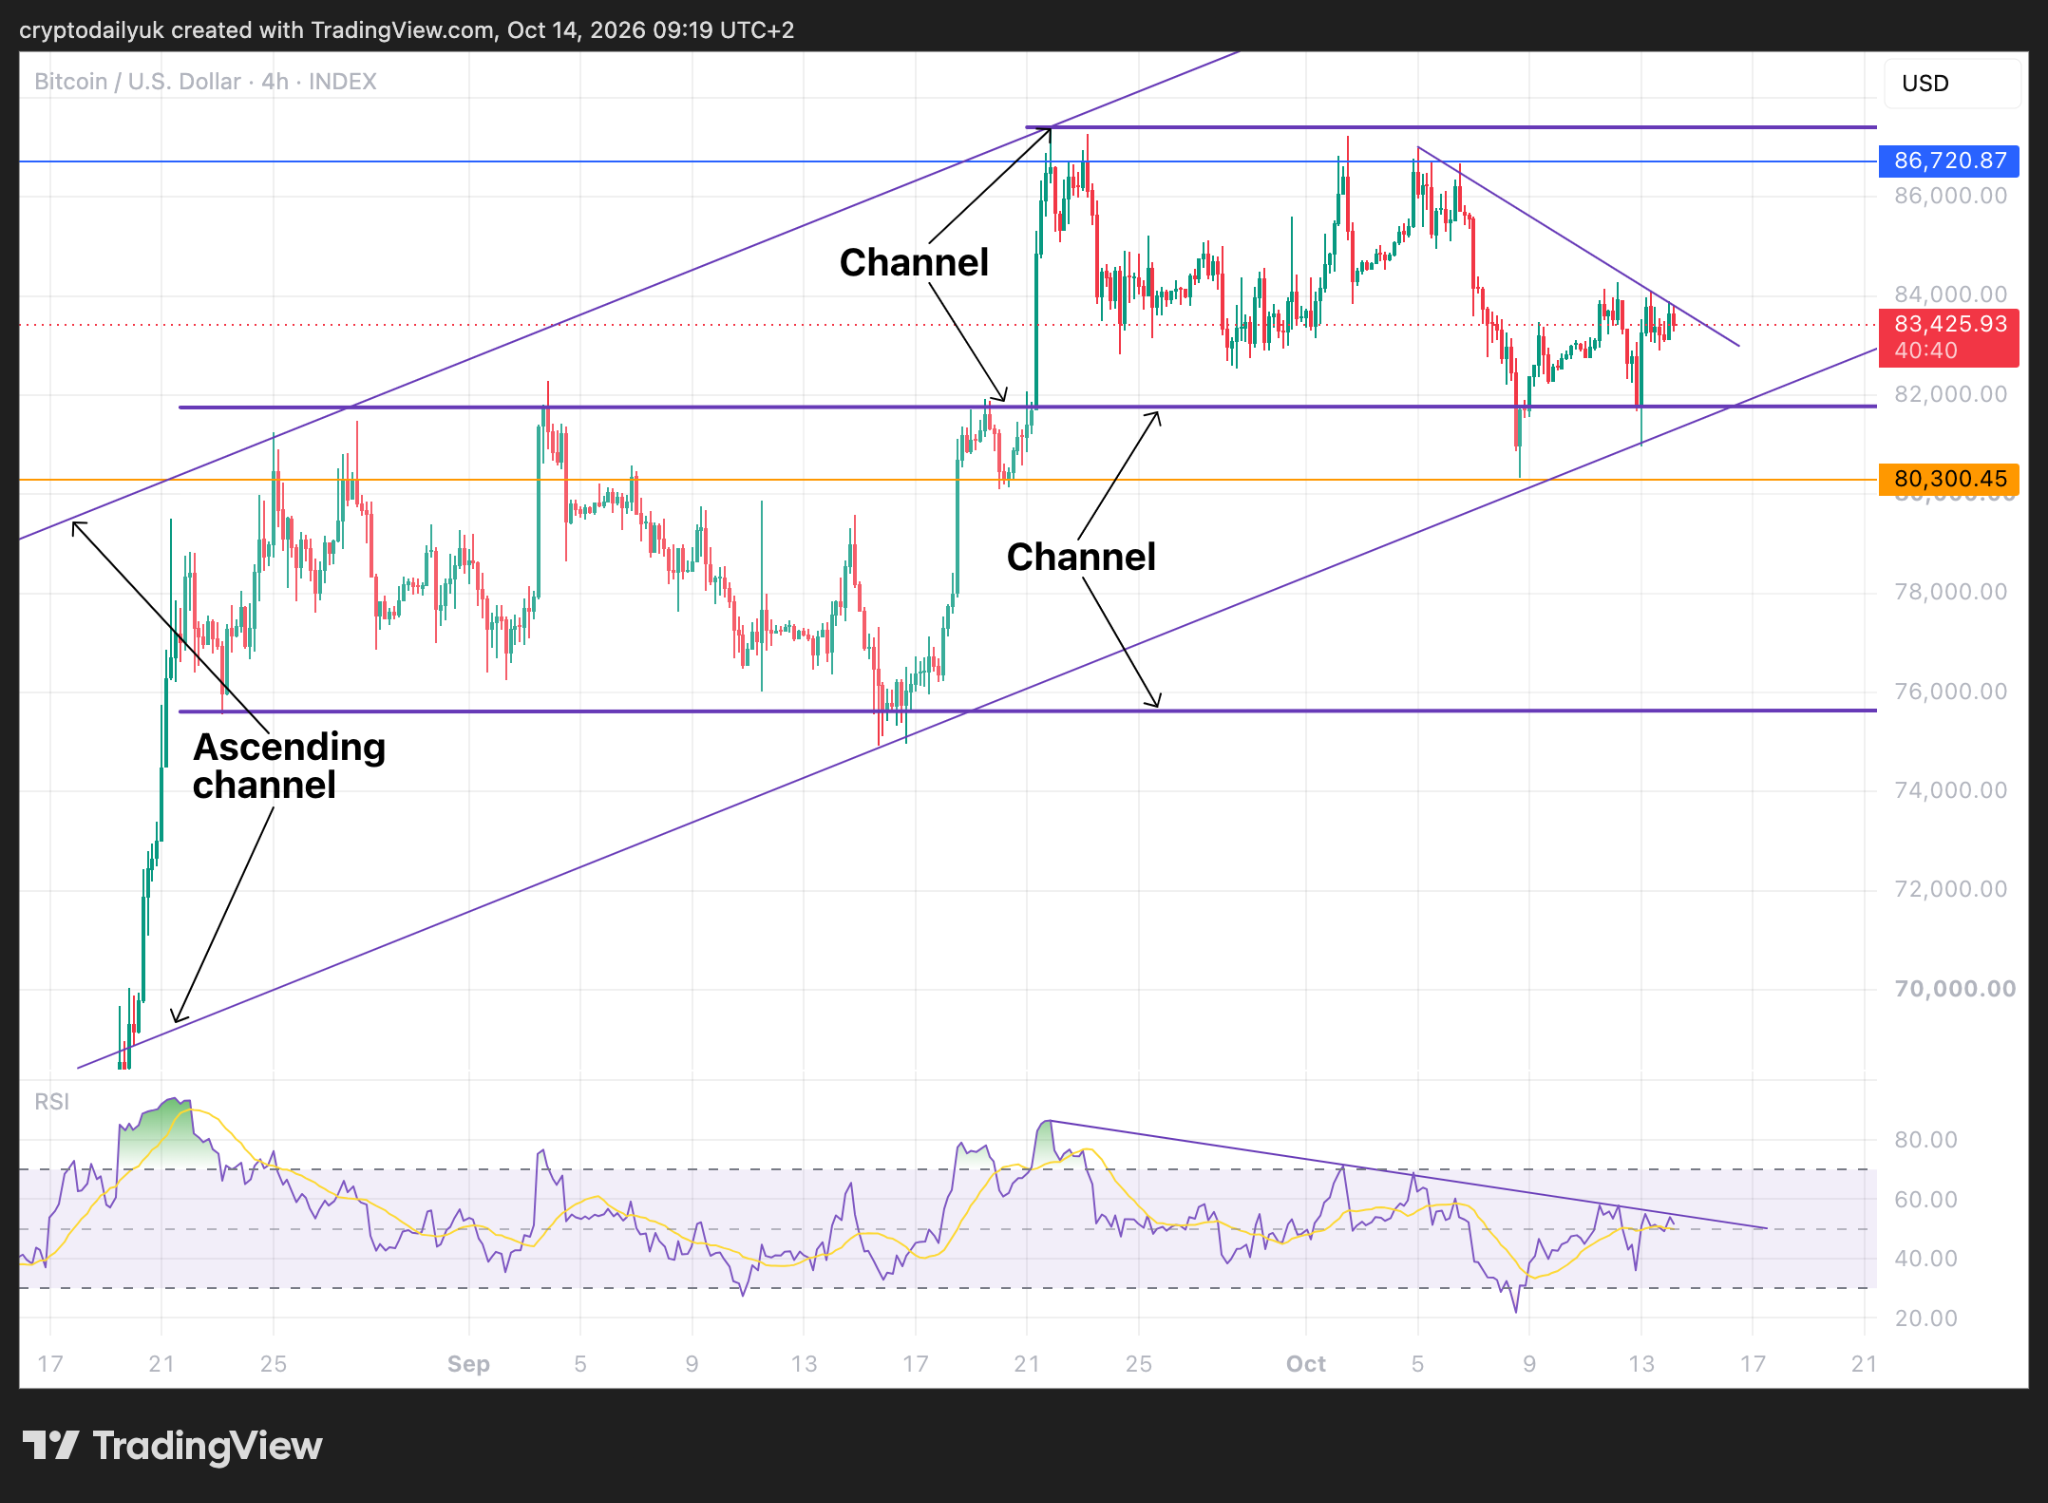
Since rising into a first parallel channel back in August, and then into a second one, based on top of the first, the $BTC price action seemed messy and uncertain. However, an ascending channel now encompasses all of the price action and appears to give a far more accurate pattern representation. Even so, there are still only two touches of the top of the channel. Another one will be needed in order to fully validate it.
The $BTC price is quite near the bottom of the channel now, so it will be important for the bulls to make sure that the price does not dip and confirm below. A small descending trendline needs to be broken to the upside. If it is, the price could rise to the $86,720 resistance level with the chance of making the first higher high, possibly beginning a trend break after a series of lows.
At the bottom of the chart, the RSI illustrates a descending trendline with the indicator line only just below it. A break above the trendline would likely be reflected in a break of the trendline in the price action.
50-day SMA acts as support again
Source: TradingView
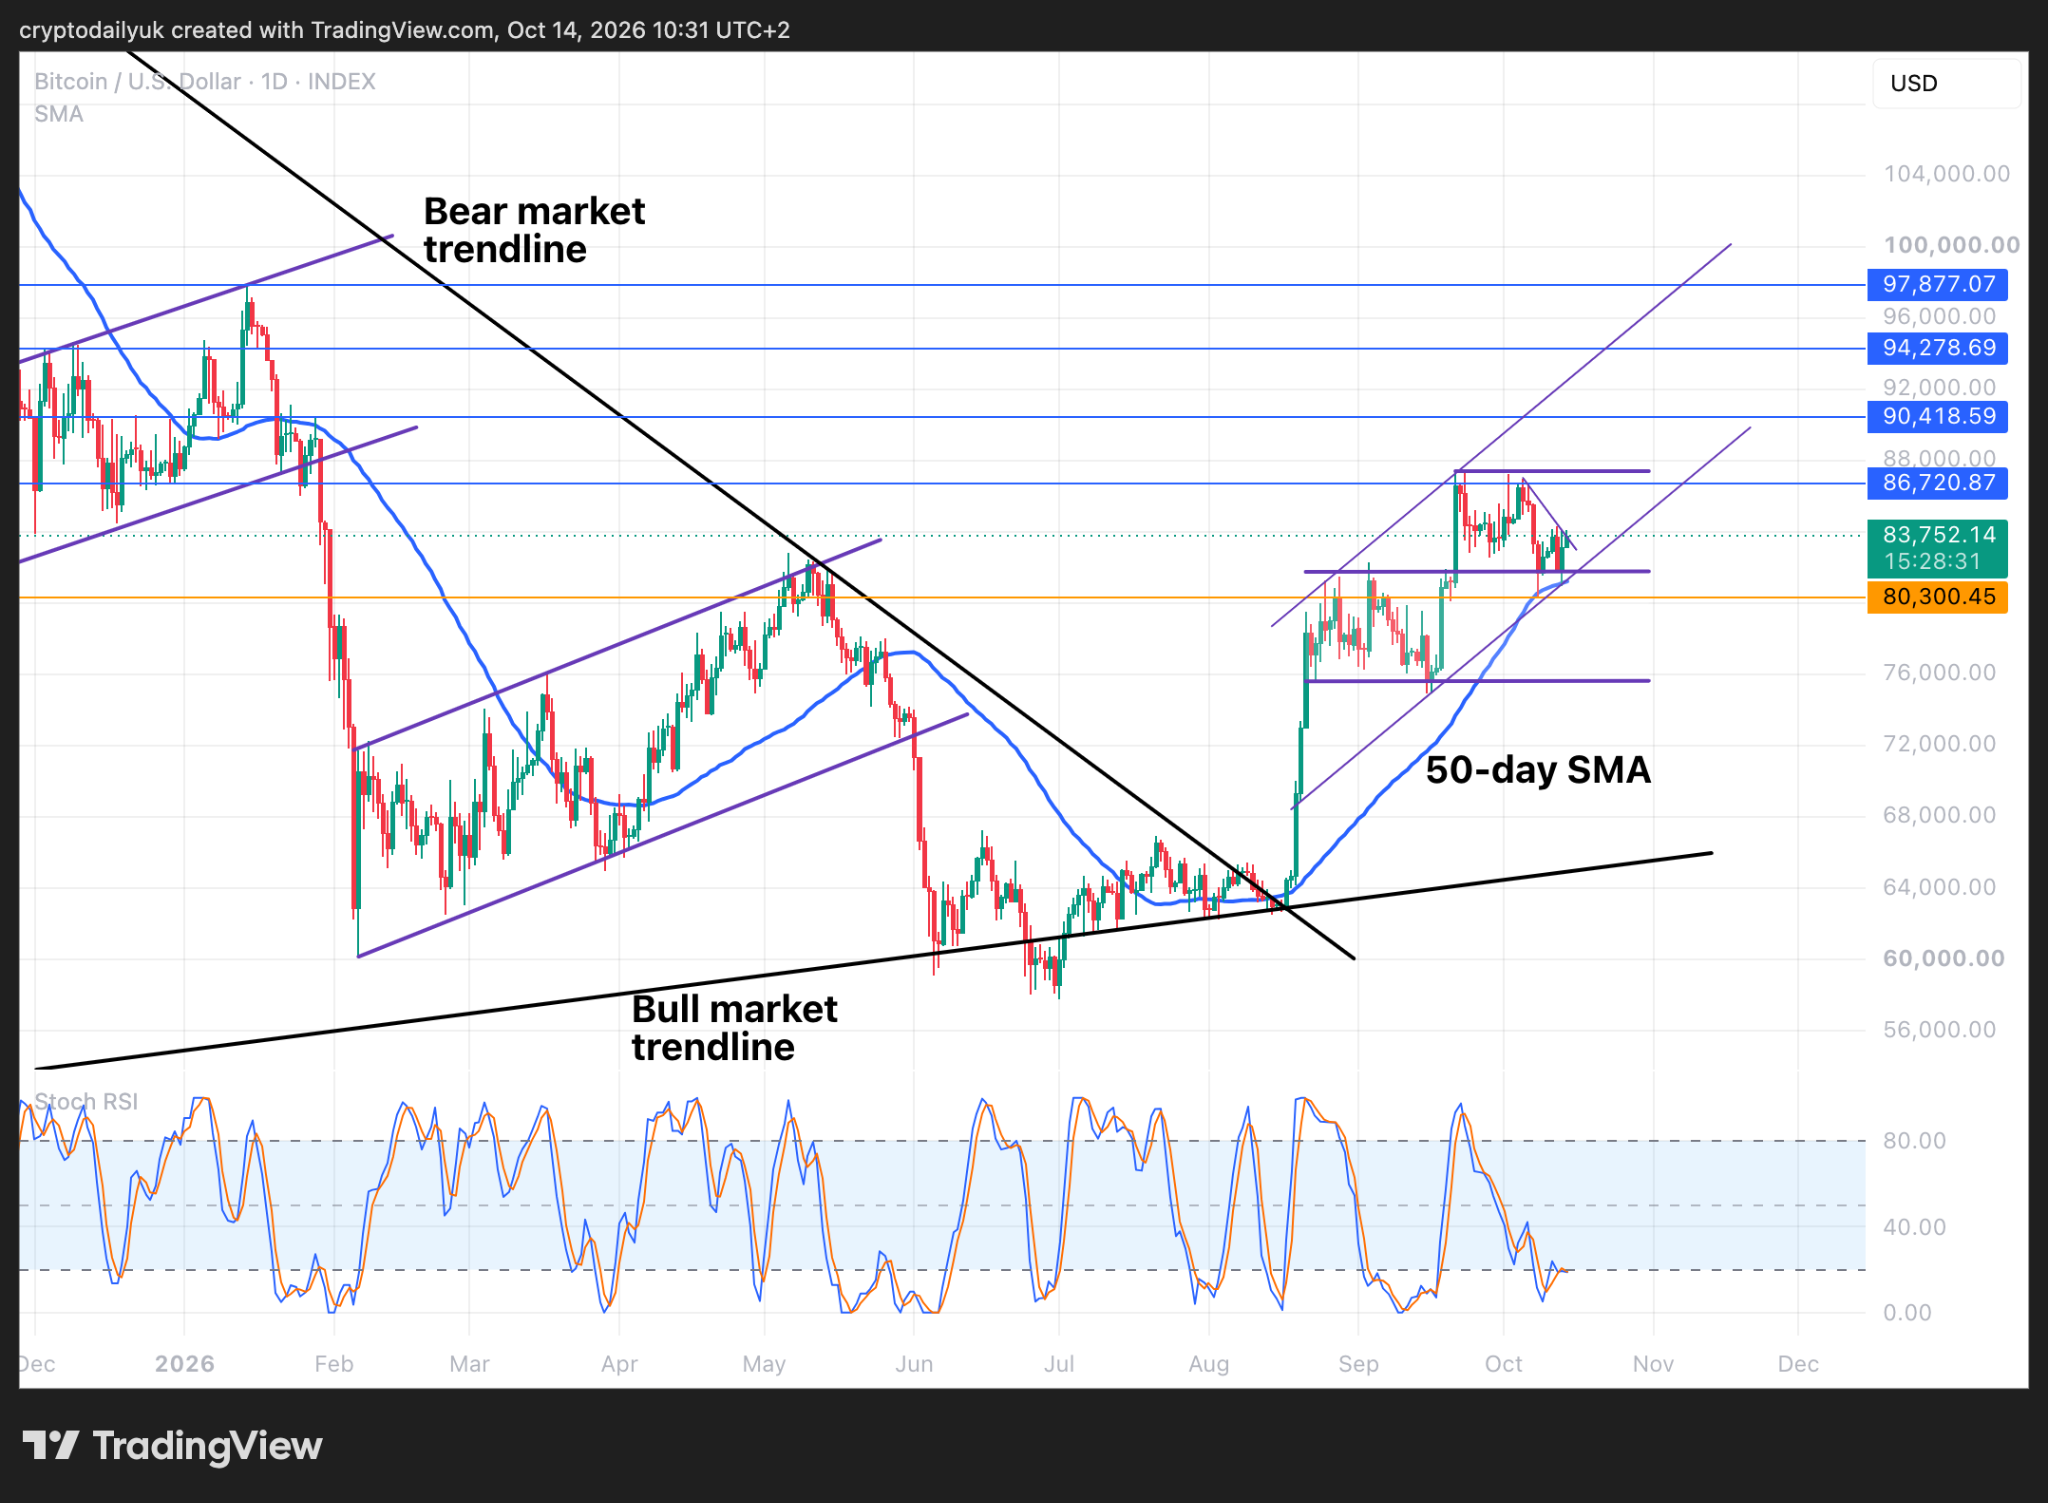
The daily time frame shows how the $BTC price is in the second step up within the ascending channel. A breakout of the parallel channel would then perhaps lead to the formation of the third stair step up.
An excellent help here could be the 50-day simple moving average (SMA). Twice now the price has come down to this moving average and has bounced from it each time. It will be important now that the 50-day SMA maintains an angle to the upside that keeps it in touch with the rising channel. If it rolls over, this will likely be a signal that the $BTC price is already on its way down.
With all the positivity so far, the negatives need to be mentioned. The Stochastic RSI at the bottom of the chart is actually poised in a cross-down position. This is certainly not what the bulls ordered, and a roll-over of these indicator lines could cause enough damage to stop the ascending channel in its tracks and signal a breakdown to around $70K.
Signs emerging of a coming breakdown?
Source: TradingView
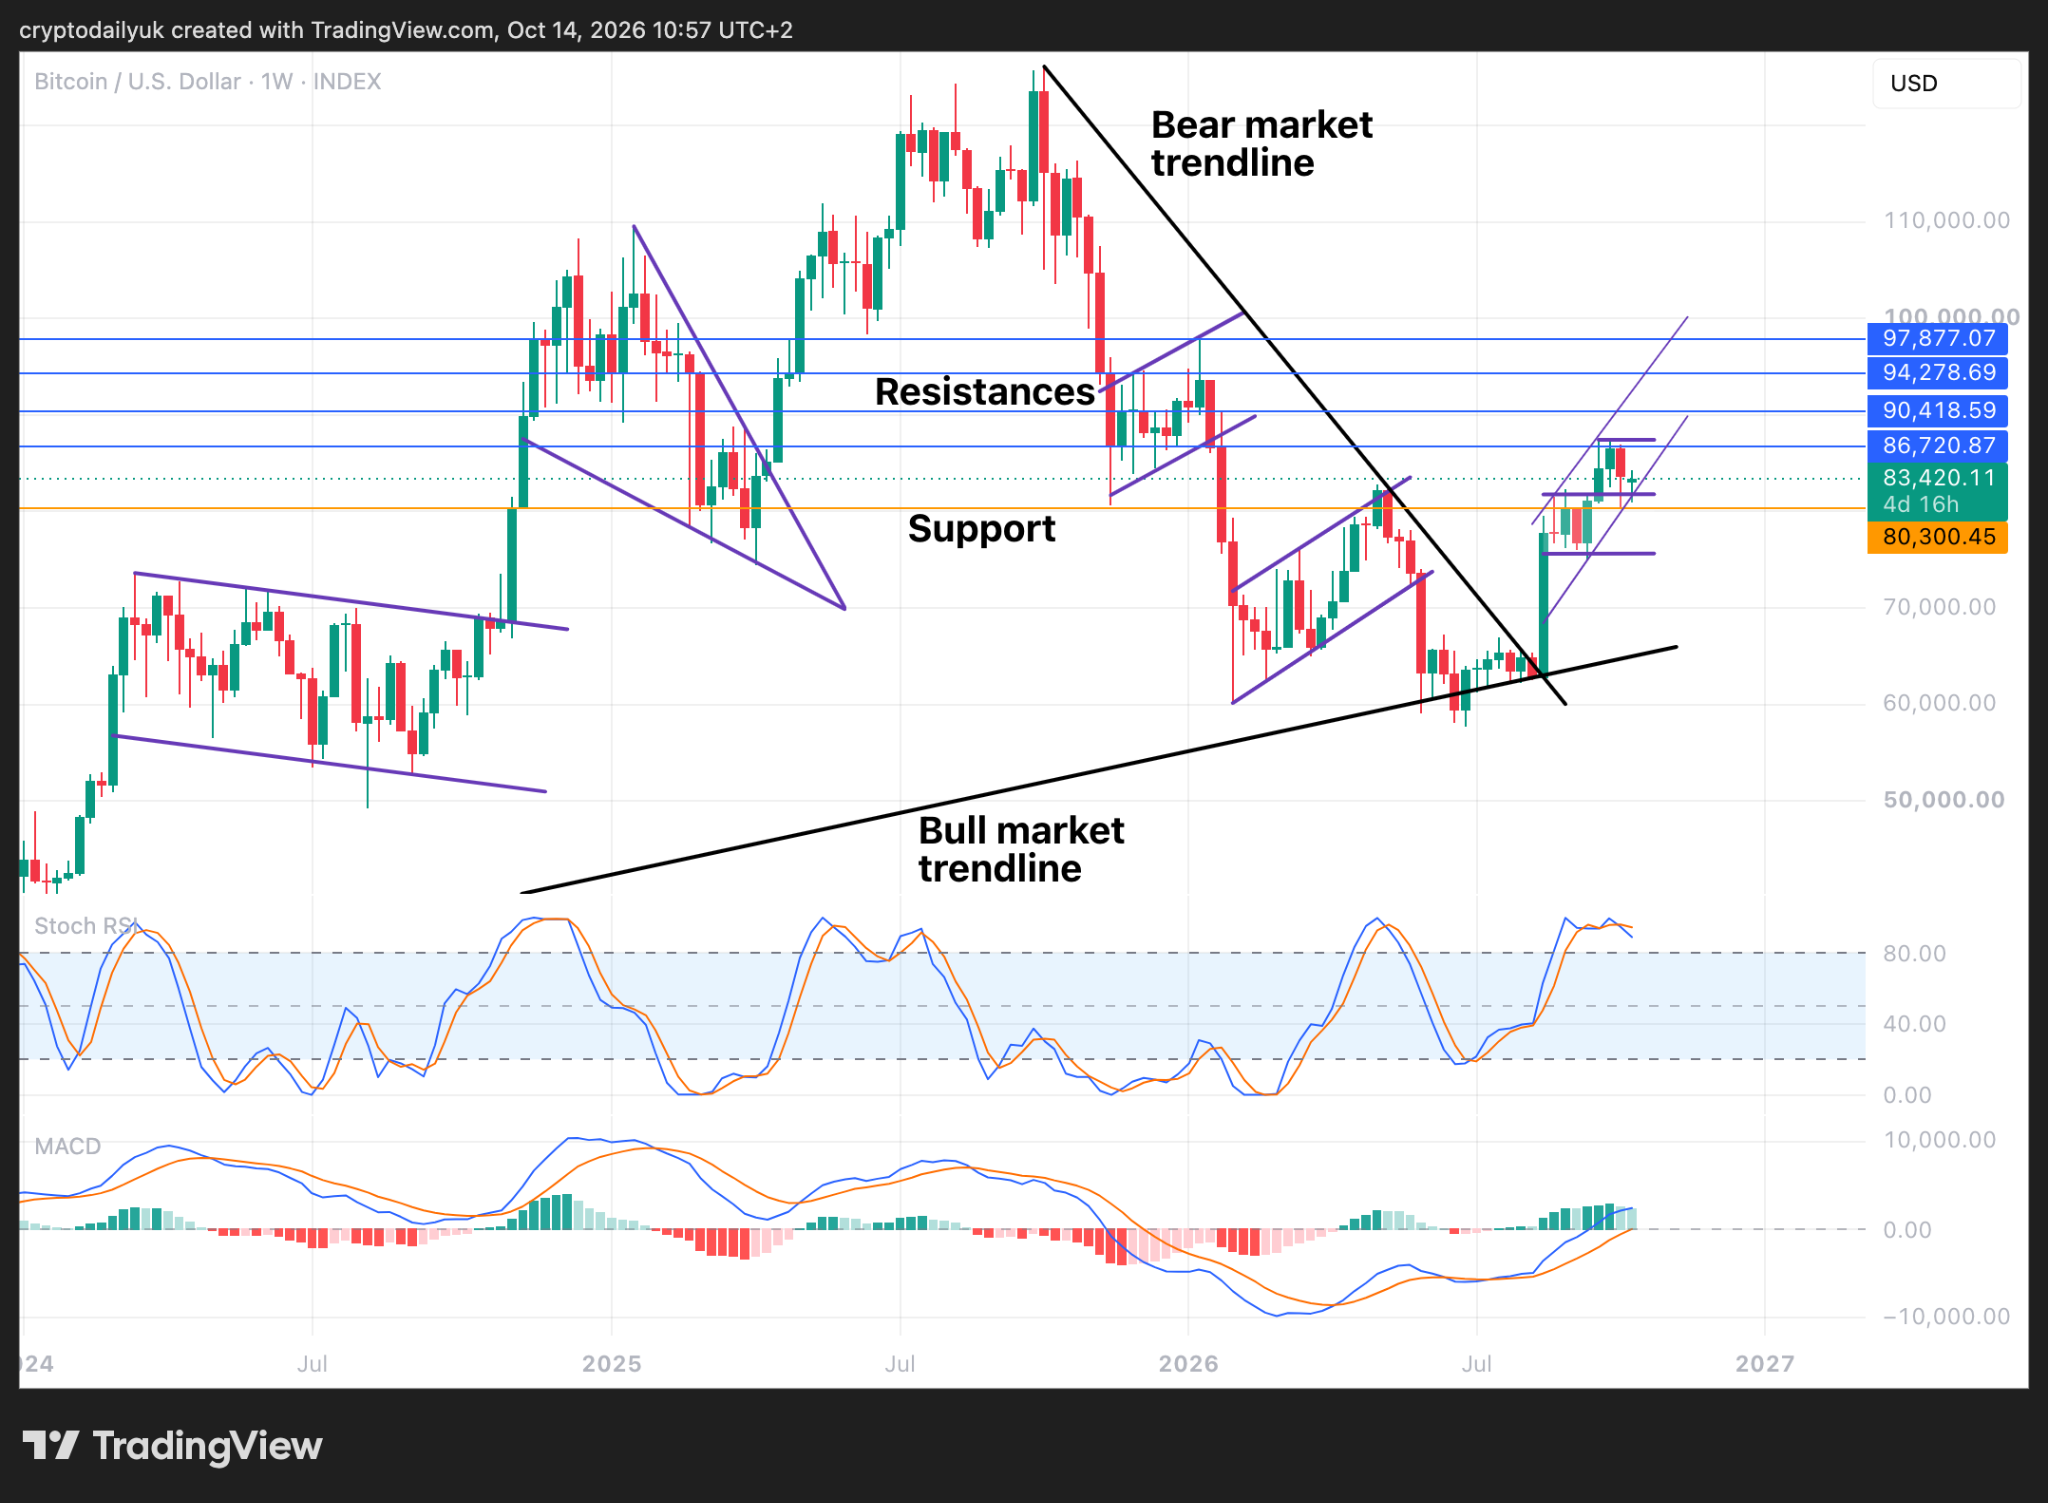
Continuing with the bearishness out into the weekly time frame, are the signs now there that this heroic Bitcoin rally could already have topped? The tops of the recent weekly candle bodies closed exactly underneath the $86,720 horizontal resistance level, which provided support for the entirety of the price action in the first big bear flag of the bear market until the first big drop.
Unless there is a turnaround in falling momentum, a breakdown could be approaching. Of course, there is still plenty of the week left for the rally to reignite, but other signs are also showing.
The Stochastic RSI indicator lines have crossed down from the very top of their limit, so unless there is a bounce at the 80.00 level, this is a negative signal.
Also, in the MACD, the blue line looks as though it may be starting to flatten out, while there are now two smaller light green columns in the histogram.
All these signs point to a faltering $BTC price, and given the intense rally that we have witnessed over the last several weeks, a decent-sized correction is probably due. Keep your eyes on the bottom trendline of the ascending channel. If this breaks and confirms, the correction will be upon us.
Disclaimer: This article is provided for informational purposes only. It is not offered or intended to be used as legal, tax, investment, financial, or other advice.





Be the first to comment