


What to know:
- Early Bitcoin holders are both selling and buying, showing a shift rather than panic.
- Bitcoin is testing a critical resistance zone near $78K–$80K on the weekly chart.
- A confirmed breakout could change trend direction, while failure may extend the downside.

Bitcoin is moving through a mixed phase as long-term holders and short-term price signals send different messages to the market.
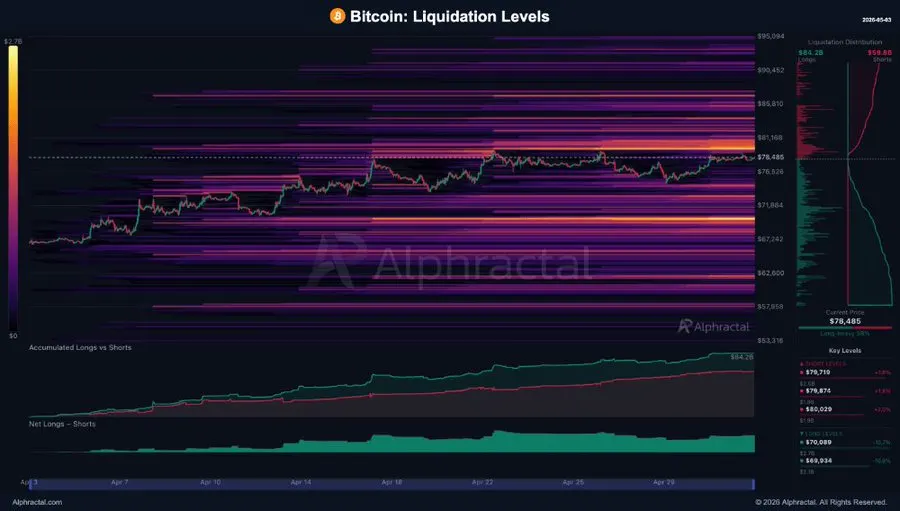
Two wallets that were over 14 years old became quite active, as shown in the data provided by Alphractal on May 3. The first wallet had been selling 11,300 BTC for about $750 million. In contrast, the other wallet had accumulated about 7,000 BTC for almost $470 million.
The division between early purchasers is evident. This category of investors, referred to as original BTC participants, usually transacts coins whenever there is significant market activity.

However, recent statistics indicate no panic selling. Rather, life span and Coin Days Destroyed metrics imply cash movement rather than withdrawal.

Source: X
Some longtime owners are now cashing in on their holdings after many years in hopes of making profits, whereas some still consider it profitable to buy at the present prices.
This combination of both buying and selling by the most experienced investors complicates the market’s perspective.
Also Read: Dogecoin Range-Bound as Bullish Wave Pattern Emerges, Targeting $1–$4 Zone
Weekly Structure Approaches A Critical Turning Point
On the other hand, according to market analyst CRYPFLOW, Bitcoin’s current weekly setup aims to move into a bullish stance once more.
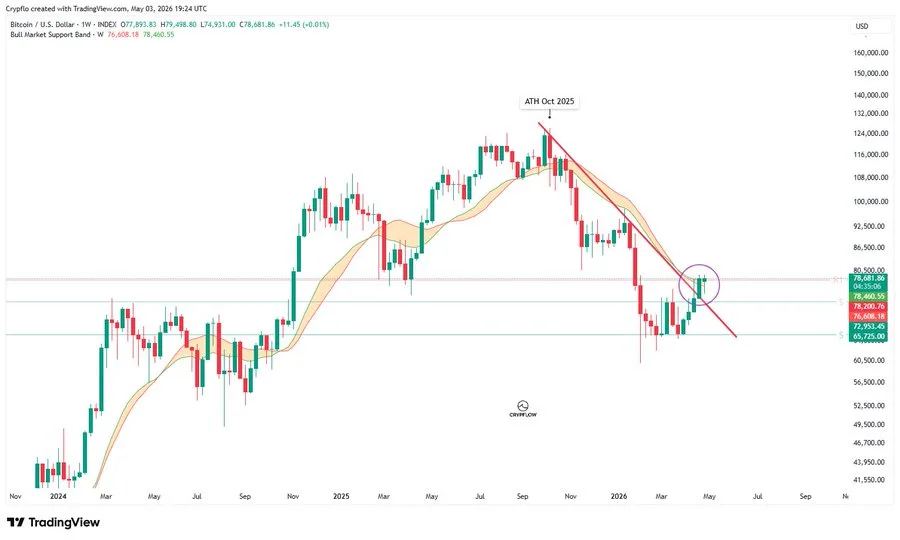
In the latest weekly analysis by the analyst, Bitcoin has broken above the multi-month trend line, which was previously the resistance for the crypto.
Currently, Bitcoin is attempting to test its bullish support range with resistance around the $78,000 level. If Bitcoin breaks out and climbs above this region, then it may reflect that the overall trend has changed.
However, if it fails to sustain this price range, it will probably be pushed back down, and the overall outlook will remain negative. There is little time left for the weekly candle to close.

Source: X
Bitcoin Resistance Zone Defines Next Market Direction
The broader picture reveals that Bitcoin had been on an uptrend from 2024 to late 2025, setting new peaks all the way up until its peak. Thereafter, the market became bearish, with lower peaks and troughs.
In the course of the decline, the price dropped below the key moving averages, which subsequently served as a resistance barrier and demonstrated bearish supremacy.
At the beginning of 2026, Bitcoin was supported at the $65,000-$70,000 level and started to rise back up from there.
Currently trading close to $78,600, Bitcoin tests the area of overlap between a descending trend line, previously acting as support, and key moving averages. The crucial levels to follow are $72K, $76K, $78K, and $80K.
This article contains market analysis and price predictions. These are not guarantees. Crypto markets are volatile. Always DYOR. Not financial advice.
Also Read: Binance Coin (BNB) Consolidates Above $600: Is a $12,000 Surge Coming?

Be the first to comment