




All news is rigorously fact-checked and reviewed by leading blockchain experts and seasoned industry insiders.
- Weekly losses across major altcoins show that market weakness had developed before Thursday’s latest decline.
- Ethereum accounted for roughly 30% of forced closures, highlighting concentrated pressure on leveraged bullish positions.
- Bitcoin’s daily chart shows weakening recoveries after its early-October rally, with the latest candle still forming.
The cryptocurrency market extended its losses on October 15, shedding 3.77% of its value as total capitalization fell to approximately $2.7 trillion, according to CoinMarketCap.
Bitcoin traded near $80,730 during the early European session, while Ethereum and several major altcoins experienced steeper percentage declines.
The sell-off followed stronger-than-expected U.S. inflation data released on Wednesday. The Bureau of Labor Statistics reported that consumer prices rose 0.6% in September, pushing annual inflation to 3.7%. The figures renewed concerns that persistent price pressures could limit the Federal Reserve’s room to ease monetary policy, weighing on investors’ appetite for risk.
The decline also triggered widespread forced closures in cryptocurrency futures markets, with leveraged bullish positions bearing the brunt of the losses.

Altcoin Losses Reveal Broader Market Weakness
The decline affected most leading cryptocurrencies, although the scale of the losses varied significantly across assets.
The seven-day performance figures provide important context for Thursday’s trading.
Solana’s weekly percentage decline was nearly five times Bitcoin’s, while Dogecoin and Ethereum also recorded substantially deeper losses over the same period.
This suggests that selling pressure across parts of the altcoin market was already established before the latest liquidation wave.
Zcash suffered the sharpest daily decline among the selected cryptocurrencies, while TRON remained comparatively stable.
Such differences can reflect variations in market liquidity, speculative positioning and the extent of earlier price gains. They also show why Bitcoin’s performance alone does not capture the full scale of a cryptocurrency downturn.
CoinGlass Reports $972 Million in Liquidations
CoinGlass recorded $972.44 million in liquidations over 24 hours, affecting 182,527 traders. Long positions accounted for $891.74 million, or 91.7% of the total, compared with $80.70 million in short liquidations.

Ethereum represented the largest identifiable share of the liquidation heatmap, with $292.81 million in forced closures. Approximately 92% of those positions were long.
The concentration indicates that leveraged bullish traders were particularly vulnerable as prices declined. Forced closures can add to market volatility when exchanges automatically exit positions that no longer meet margin requirements.
The timing also matters. CoinGlass recorded $672.83 million of the total within the latest 12 hours, indicating that liquidation activity was concentrated in the second half of the reporting window.
Bitcoin’s Daily Chart Shows Fading Momentum
The TradingView BTC/USD daily chart captured on October 15 shows Bitcoin opening at $81,566.28 before falling to an intraday low of $80,125.
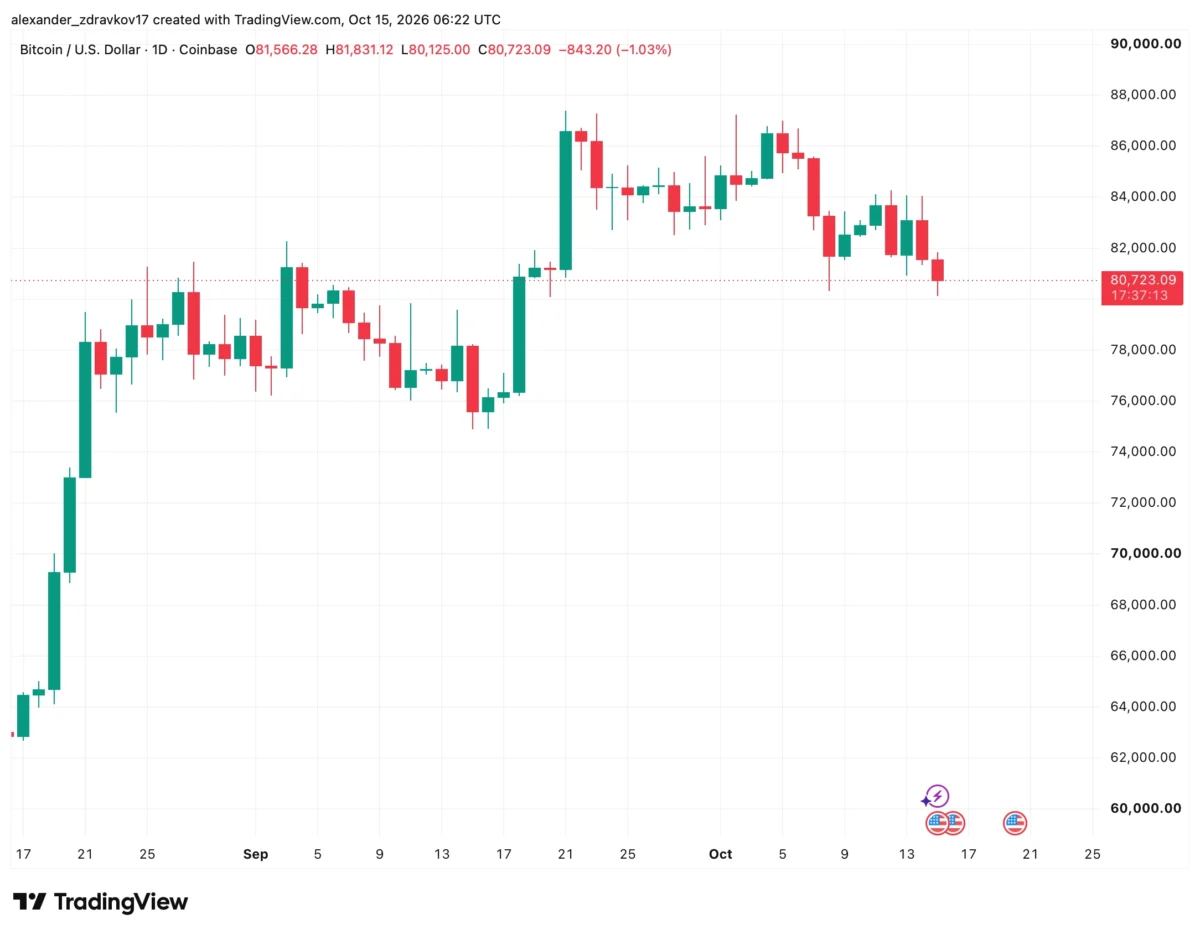
The session’s high reached $81,831.12, producing a trading range of approximately $1,706. Bitcoin was quoted at $80,723.09 when the screenshot was taken.
The broader chart reveals a deterioration in price momentum since early October.
After trading above $86,000, Bitcoin struggled to maintain subsequent recoveries. Recent rebounds failed to restore those highs, while selling pressure gradually pushed the cryptocurrency back toward its September trading range.
The latest intraday low places Bitcoin close to the psychological $80,000 threshold, although the chart does not confirm that level as established technical support.
The October 15 daily candle was still forming at the time of the screenshot. Its closing price will offer a clearer indication of whether buyers managed to recover part of the decline.
Market Sentiment Offers a Contrasting Signal
Despite widespread losses, CoinMarketCap’s Fear & Greed Index stood at 48, within neutral territory.

The reading contrasts with the heavy liquidation activity, but the two indicators measure different aspects of market conditions.
The sentiment index provides a broader assessment of cryptocurrency market behavior, while liquidation data captures forced closures among leveraged traders.
A market can therefore experience substantial derivatives-related disruption without immediately registering extreme fear.
The distinction is relevant because the latest selling does not, by itself, establish that investors across the entire market have reached a point of capitulation.
What Comes Next for Bitcoin?
The immediate focus is whether Bitcoin can stabilize following its latest decline.
The observed October 15 low provides a reference point for assessing subsequent price action, while the pattern of weaker rebounds remains important for evaluating the broader daily trend.
A sustained recovery would suggest that buyers are beginning to absorb selling pressure. Further declines could expose additional leveraged positions to forced closure.
Altcoin performance will also be worth watching. Their deeper weekly losses indicate that market weakness extends beyond Bitcoin and may continue to affect individual assets unevenly.
For now, the available data shows a broad cryptocurrency retreat accompanied by a concentrated liquidation of bullish positions, rather than evidence that the market has already established a durable bottom.


Be the first to comment