



In brief
- Bitcoin trades at $64,938, up 1.06% on the day, but stuck below iboth the short-term and long-term moving averages.
- The U.S. economy shed 23,000 jobs in July, missing the 95,000 gain economists expected; CME FedWatch cut September hike odds to 40% from 55%.
- The short-term outlook remains bearish, but dwindling rate-hike odds may give investors hope.
The U.S. labor market cracked harder than anyone expected. Employers cut 23,000 jobs in July—the first net loss since the pandemic-era recovery, and a sharp miss against the 95,000 gain economists had penciled in.
The unemployment rate ticked down to 4.1% only because more people quit the labor force entirely. June’s gain was revised to 20,000 from 57,000, and May was nearly halved.
Markets read it as a reason for the Federal Reserve to keep its hands off rates. Treasury yields fell, the dollar dropped 0.5%, and CME FedWatch showed the odds of a September rate hike sliding to 40% from 55% a day earlier.

A softer Fed path is usually a tailwind for risk assets and crypto—but Bitcoin’s chart shows a market that hasn’t reclaimed its trend.
Bitcoin price: What the charts say
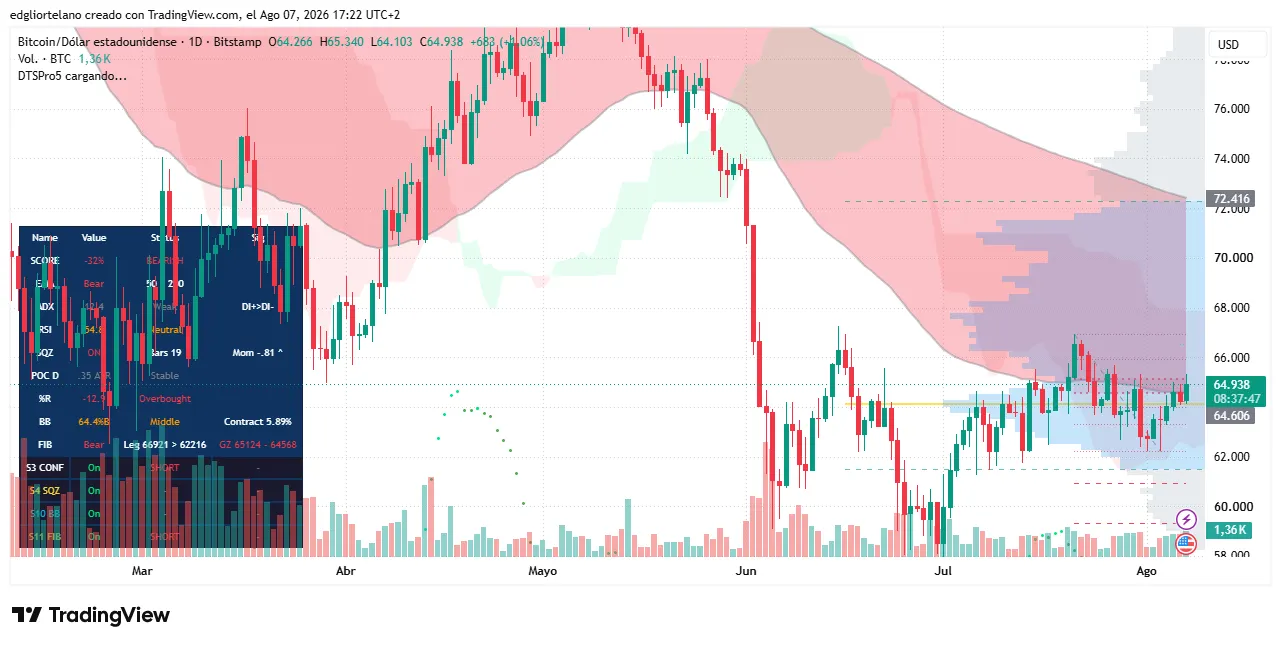
Bitcoin is trading at $64,938, up 1.06% (+$683) on the session, after a green candle closed near its high. It’s compressing below its two key moving averages.
The trajectory tells the story. BTC topped near $80,000 in mid-May, then slid to a July low around $58,000 in a clean downtrend through the spring. The 50-day EMA (the average price over the last 50 sessions) is below the 200-day EMA (the average over the last 200 sessions) in formation traders call a death cross. When the shorter average sits under the longer one, the medium-term trajectory still points down. Since the July low, the fall has flattened into a sideways coil, but price has not pushed back above either average.
The Relative Strength Index, or RSI, reads 54.6. RSI is a momentum gauge on a 0–100 scale: above 70 is overbought, below 30 is oversold. At 54.6, momentum is neutral—no fuel for a breakout, no washout either.
The bull case, considering the technicals, would form if a daily close back above the 50-day EMA and the $66,000 whole-number resistance opens a run at the 200-day EMA ($64,00) and the cloud top near $72,000. More into the fundamentals, a softer Fed and a weak dollar give that push a reason to fire. The bull case exists, but it’s thin: Bitcoin’s price has failed to reclaim the 50-day line through the whole coil.
Bear case: a break below $60,000 (the cloud floor and a round-number magnet) confirms the bears still own the structure and points back to the July low of $58,000. A daily close under that reopens the spring downtrend.
On Myriad, a prediction market developed by Decrypt‘s parent company Dastan, the outlook for Bitcoin remains bearish. Traders are currently pricing in nearly 65% odds that Bitcoin heads back down to $55K before mounting any recovery towards $84K. And those have barely moved over the last week.
For now, $65K is the line in the sand. Above the 50-day EMA, the July chop looks like base-building; below $60K, it looks like a bear flag.
The jobs report gave Bitcoin the macro cover to rally, but the death cross says it hasn’t earned it yet.
Disclaimer
The views and opinions expressed by the author are for informational purposes only and do not constitute financial, investment, or other advice.
Daily Debrief Newsletter
Start every day with the top news stories right now, plus original features, a podcast, videos and more.



Be the first to comment