



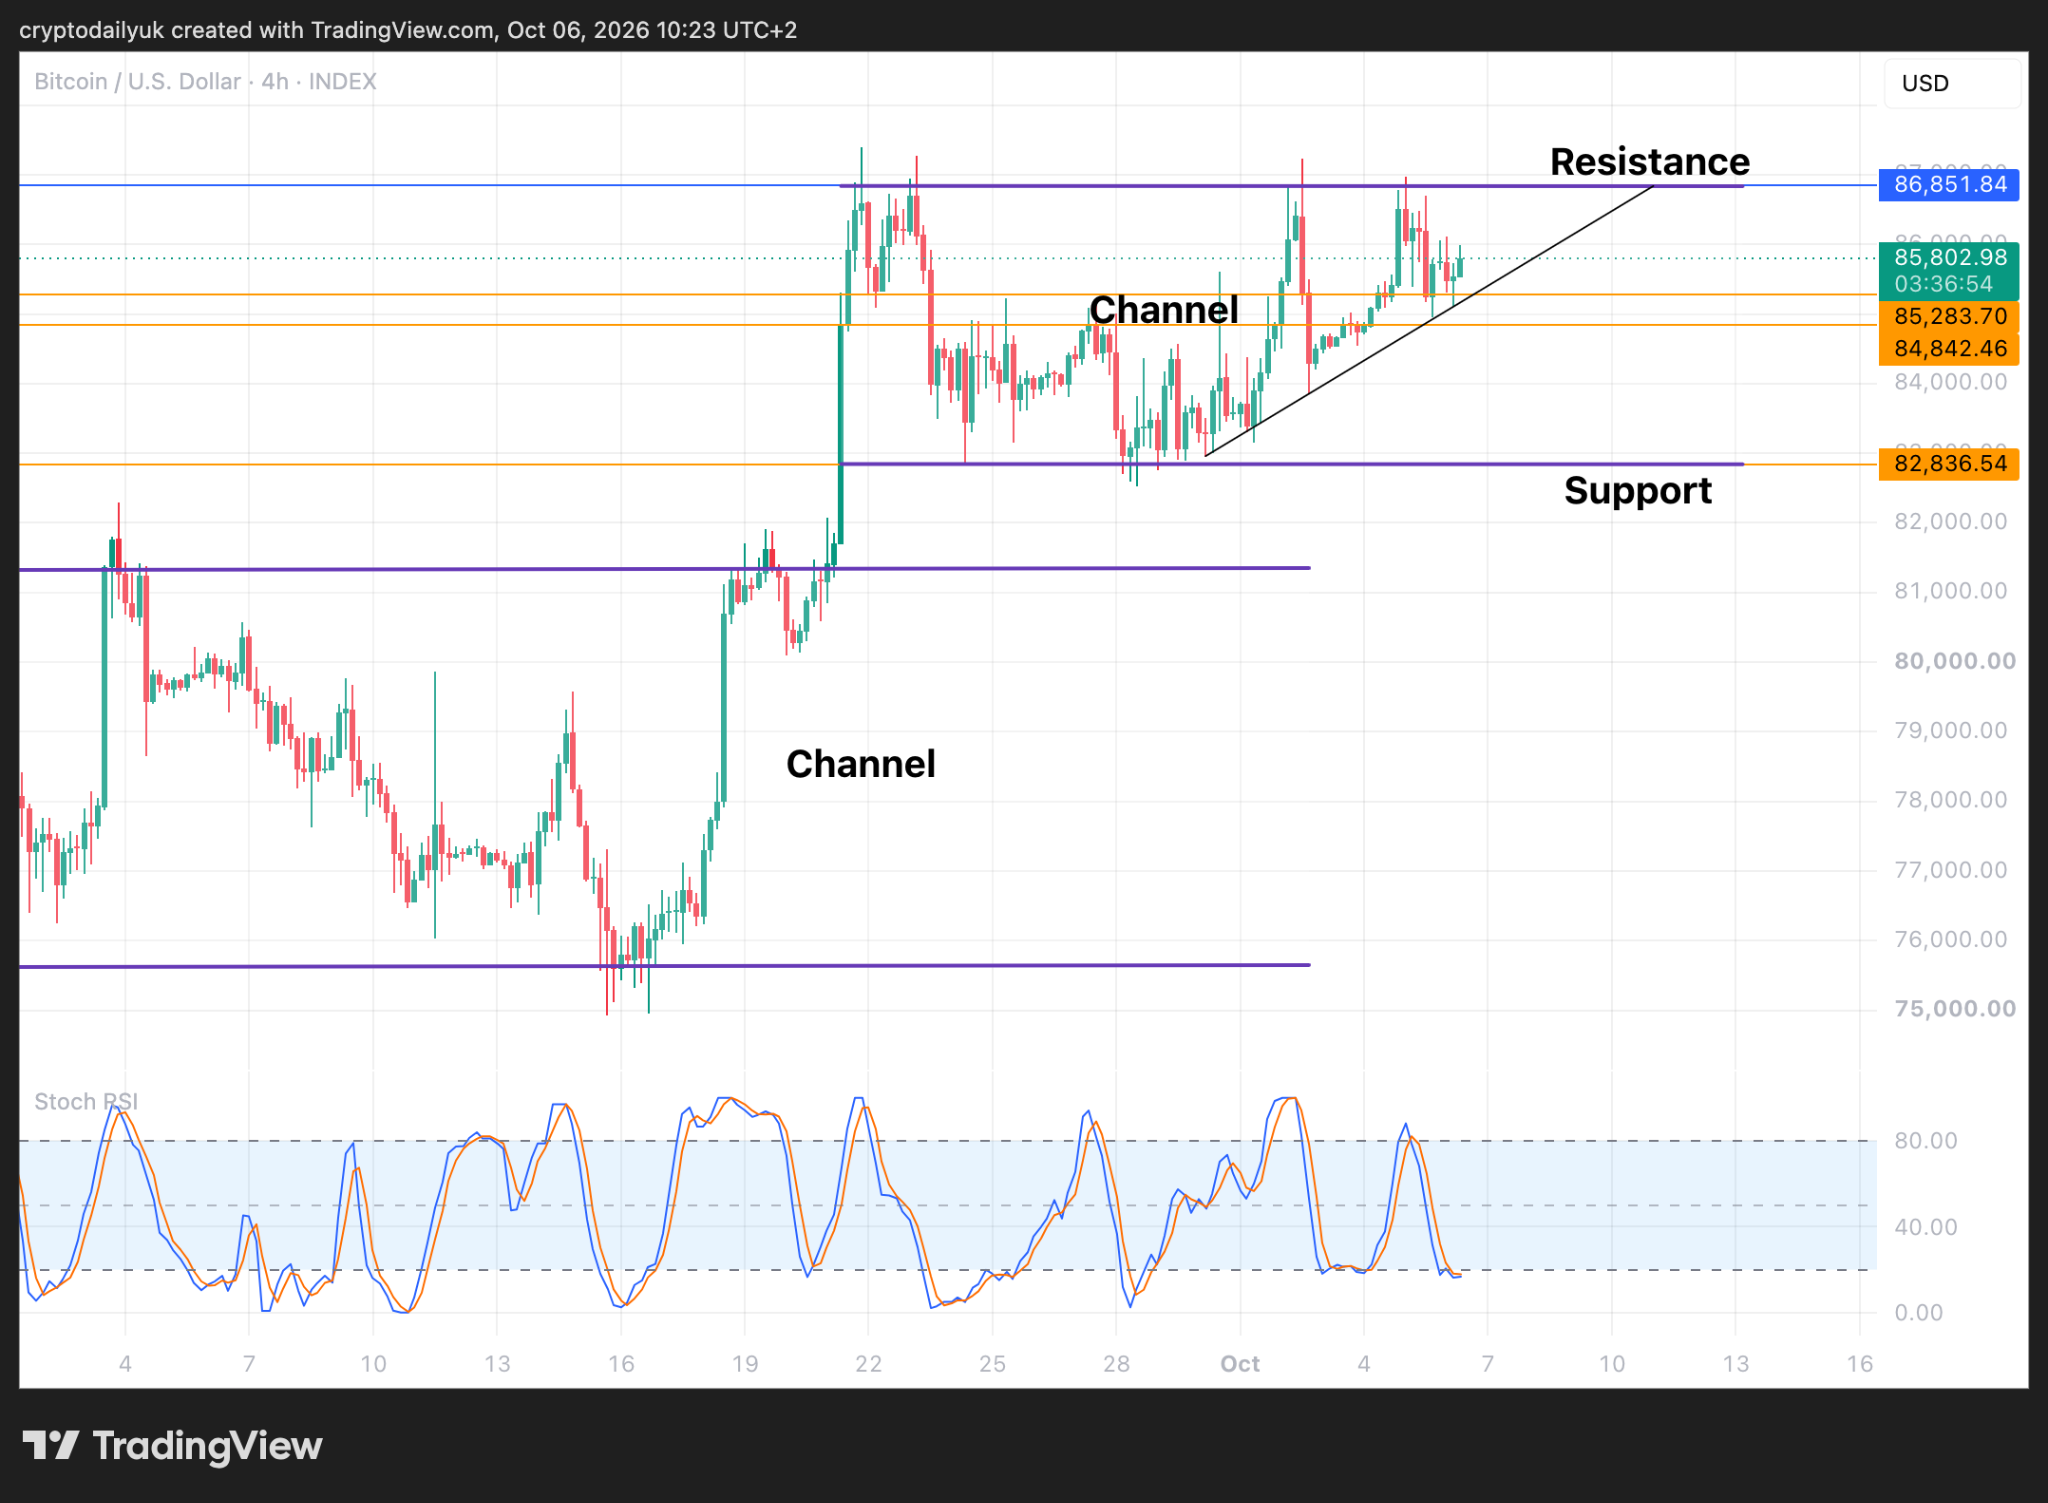
The U.S. 10-year yield went slightly higher on Monday to record a 24-year high before pulling back. In spite of this, the Bitcoin price was able to hang on to the $85K horizontal support level, only about $1,000 or so from a breakout beyond the upper trendline of a parallel channel.
A bullish setup
Source: TradingView

The 4-hour time frame chart shows the $BTC price in the upper half of the parallel channel. A rising trendline appears to be guiding the price back toward the top of the channel, forming an ascending triangle as it goes. This is a pretty bullish setup, so as long as the price stays above that trendline, a breakout is a decent possibility. This could take place either today or by Friday.
If the $BTC price does break down below the ascending trendline, there is good support down to $84,800, and then back down at the bottom of the channel. That said, this is probably not a time to be worrying about the downside.
How far can the price go after a breakout?
Source: TradingView
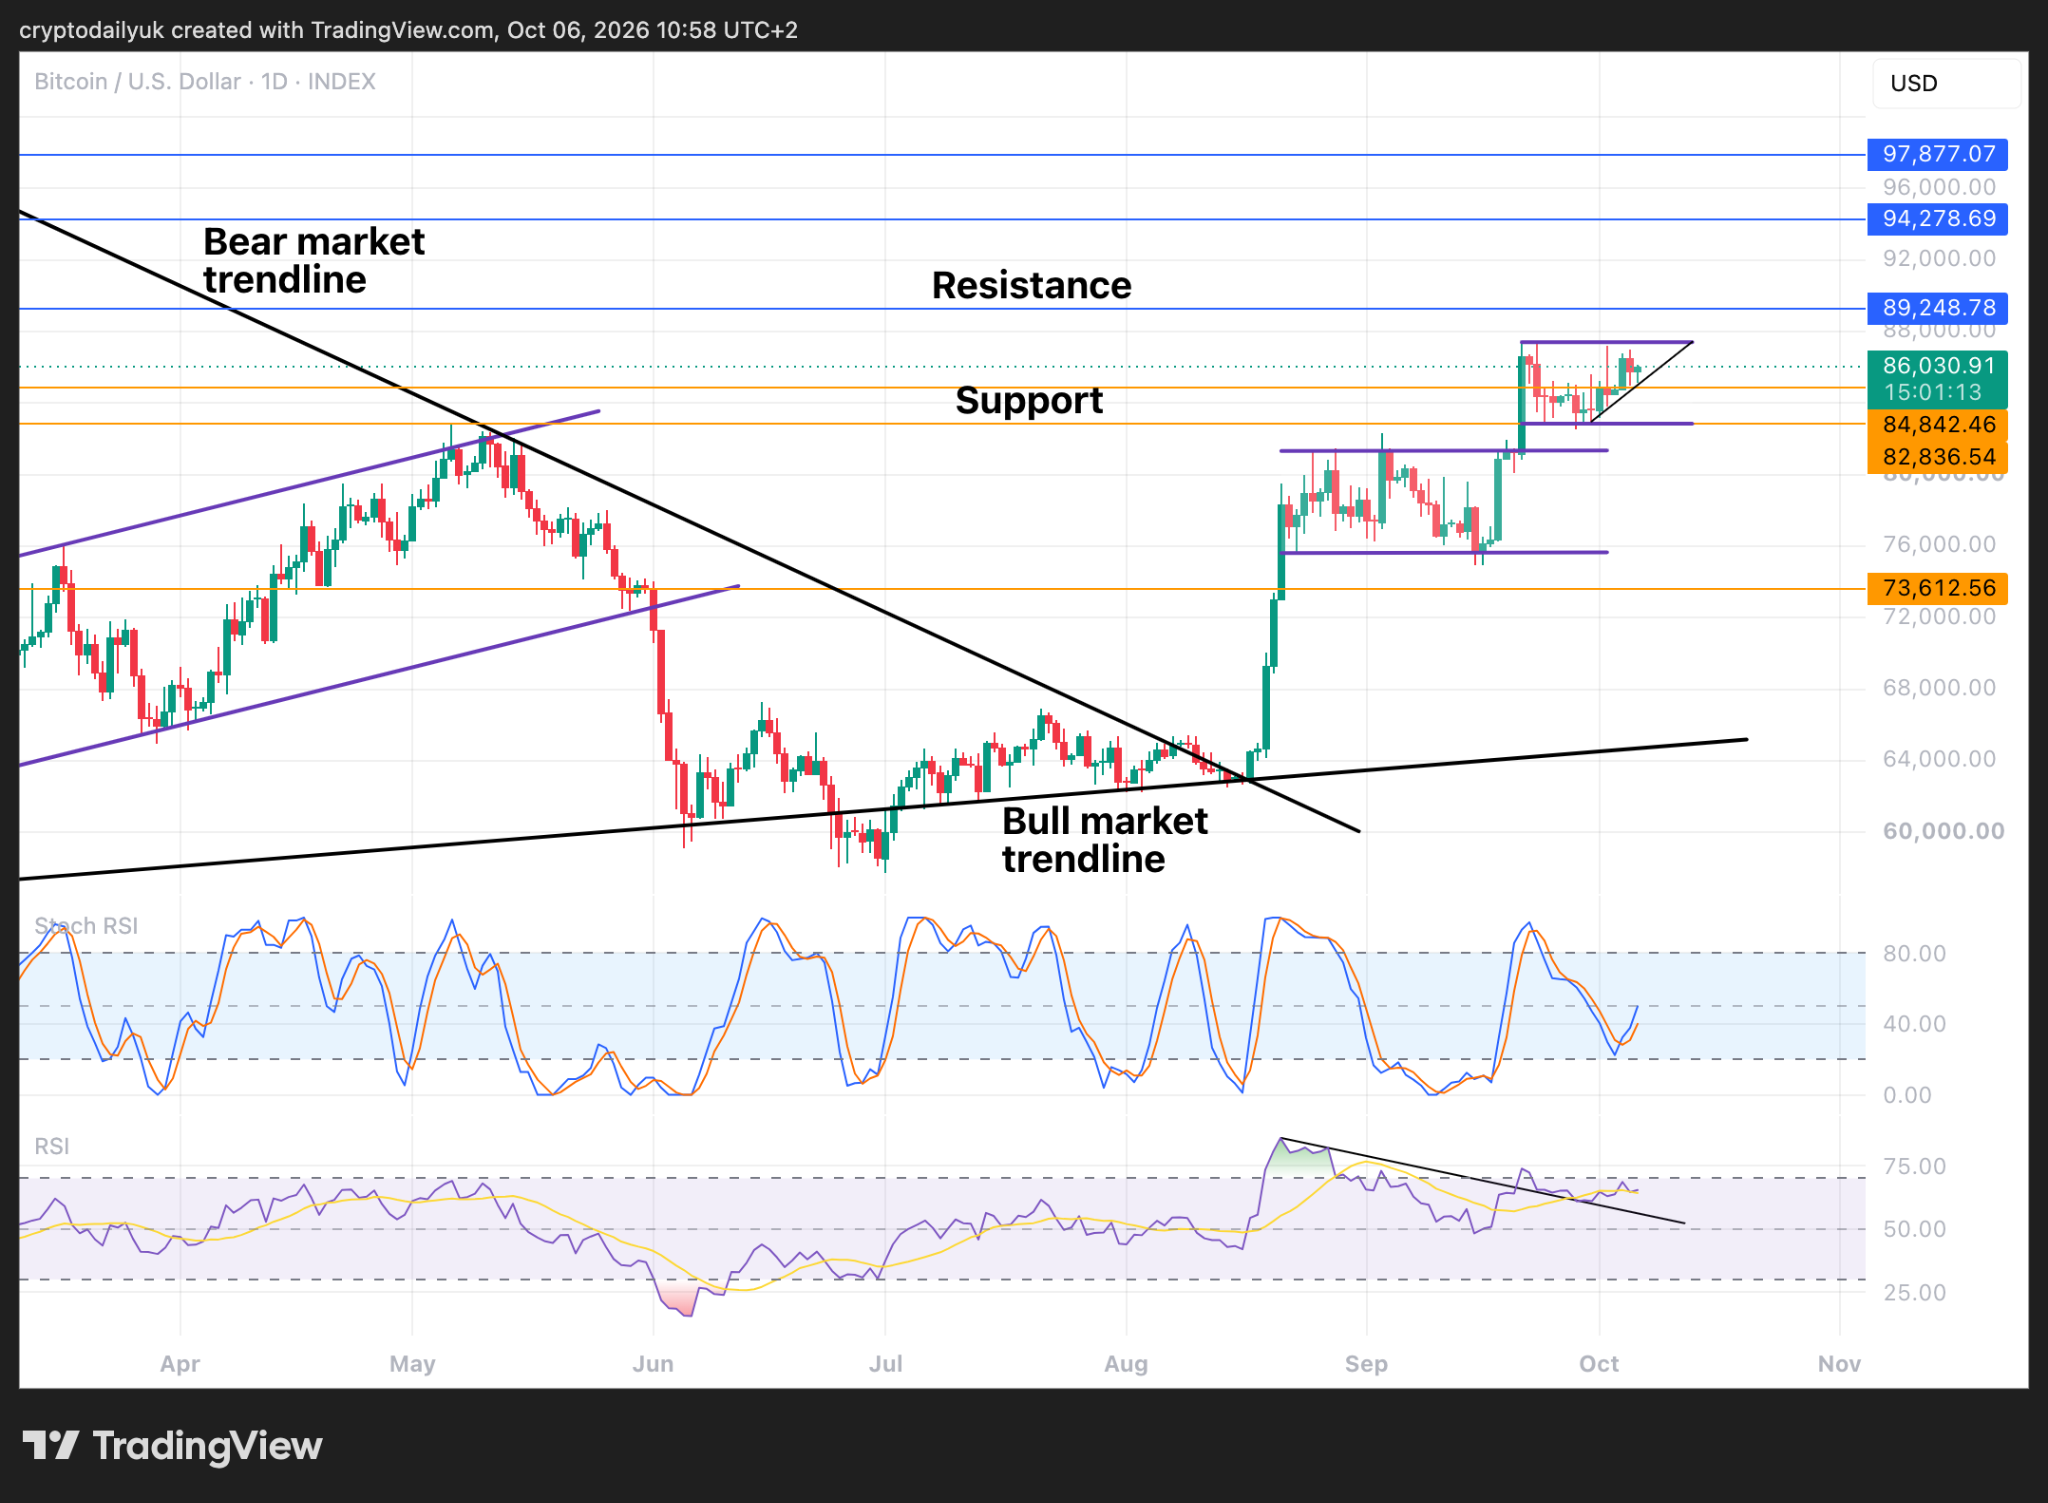
The daily chart is of quite a bullish nature. It just needs the $BTC price to ascend back to the top of the channel (which has been adjusted to line up with the swing high) where the probabilities are good for a breakout.
If this takes place, the first level of resistance is at $89,250 – a relatively easy first target. To get beyond $94,300 would be a real prize, as it is here where the horizontal resistance is the strongest, while $97,880 would definitively end the bear market, as this marks the top of the first bear flag where the downtrend started in earnest.
The Stochastic RSI indicators in this daily time frame are heading up in a strong fashion, while in the Relative Strength Index, the indicator line is still above the descending trendline. This all points to a coming breakout.
Current rally does not compare with bear market crash
Source: TradingView
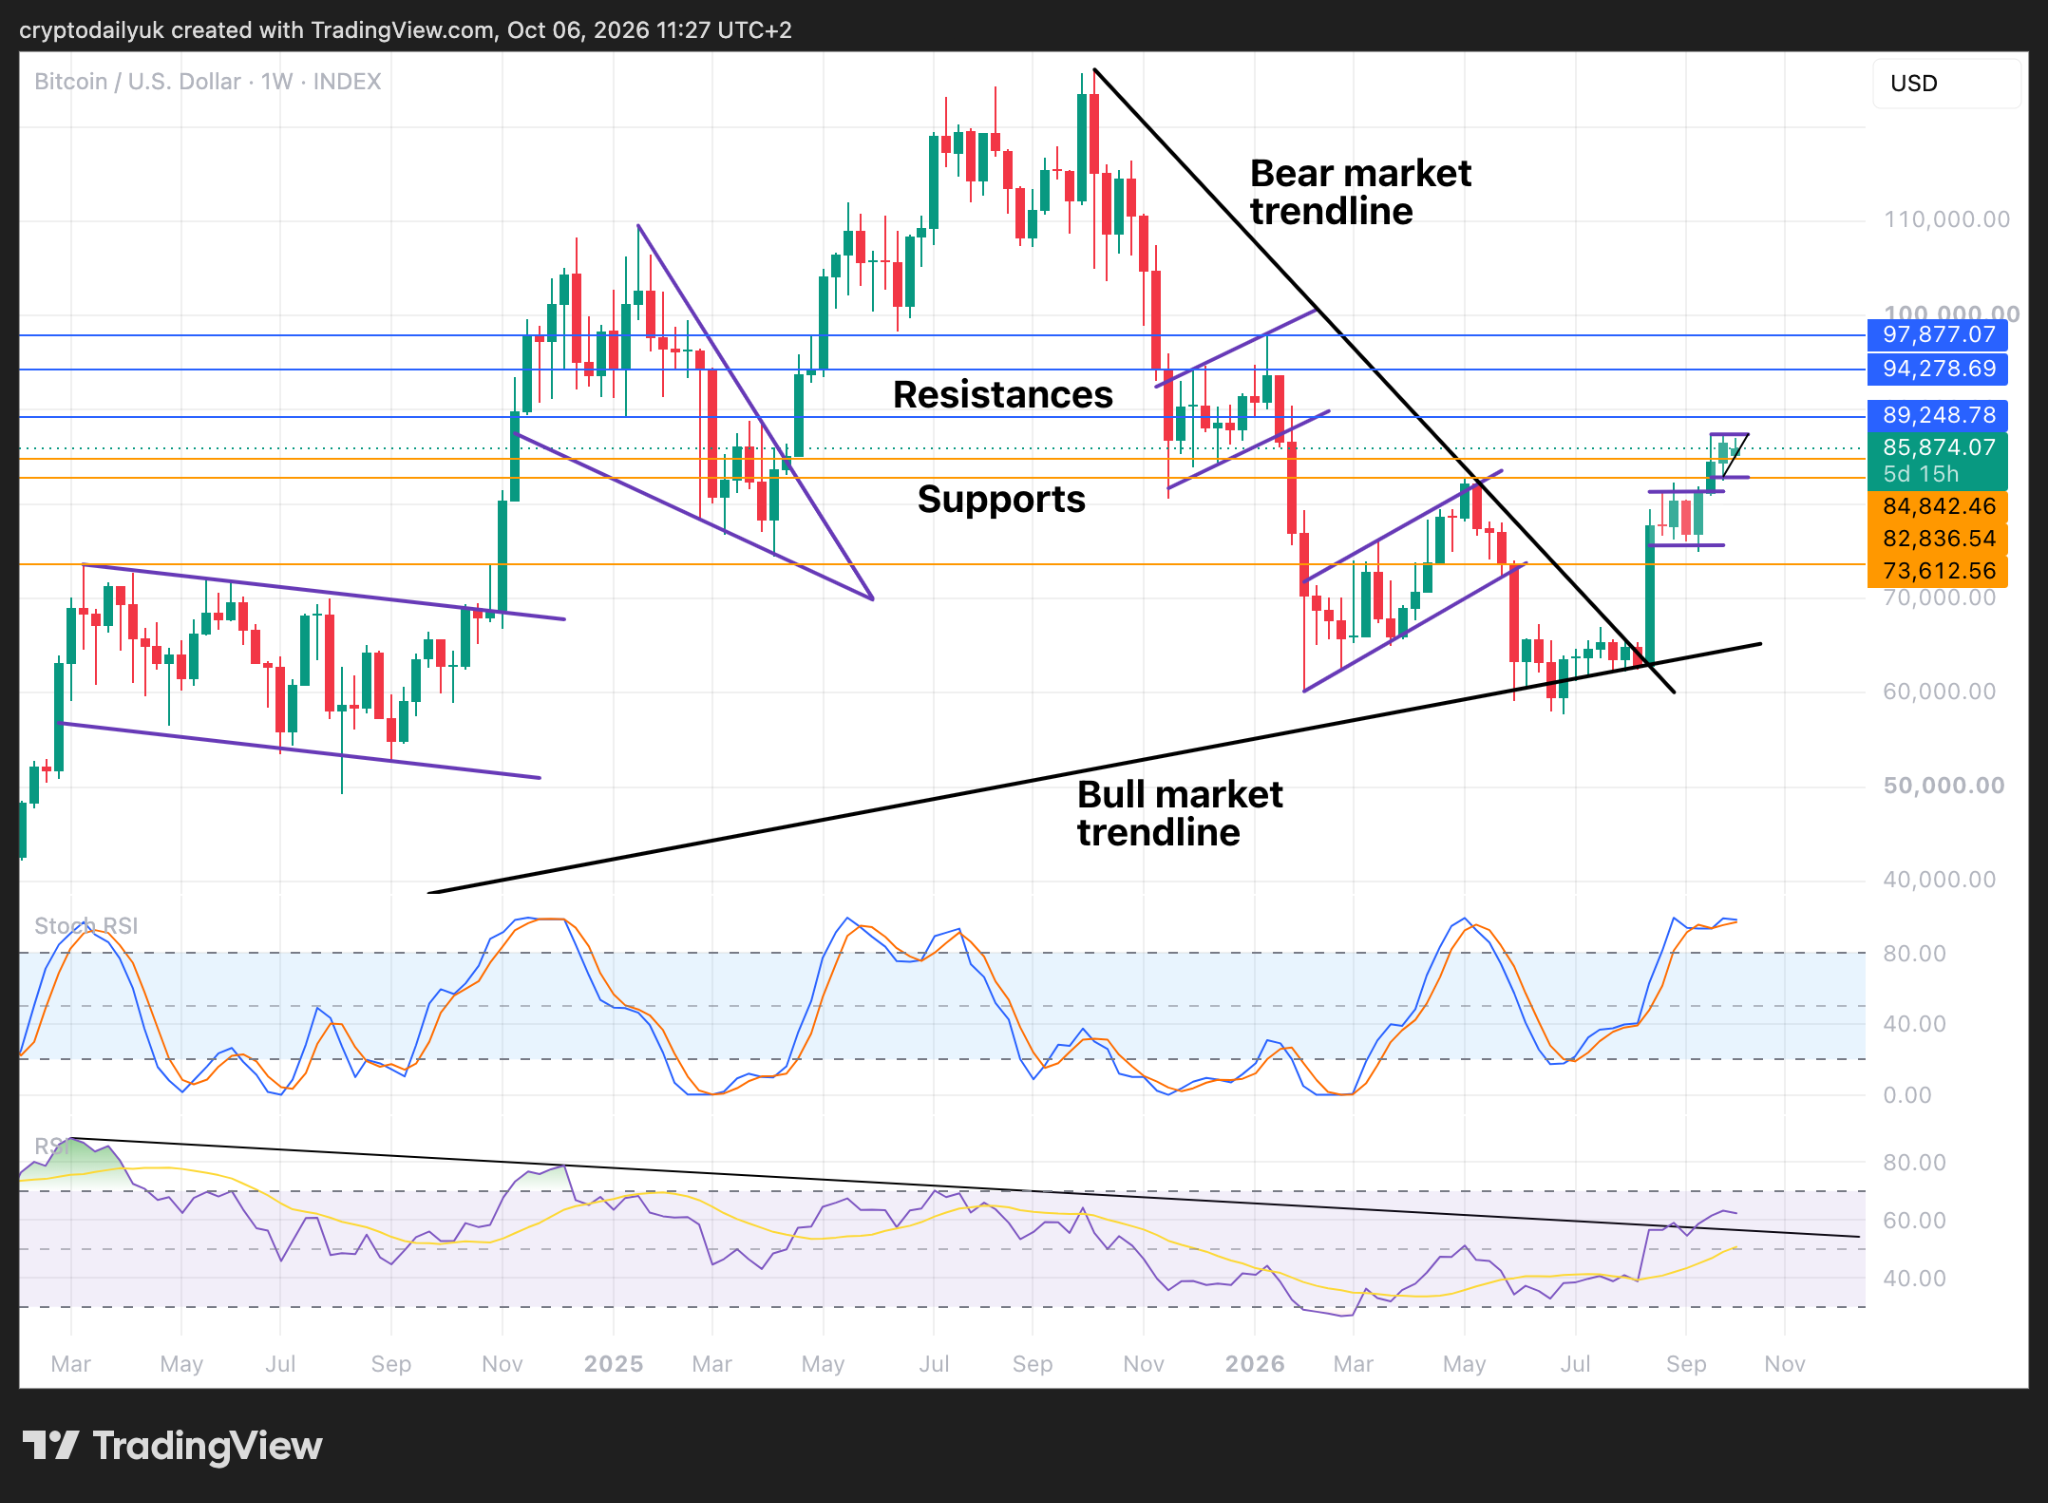
If one looks at the current strong rally out of the bear market it has to be wondered whether a local top is soon approaching, or perhaps is already established. The $BTC price has travelled up so rapidly. However, if one looks at the huge fall out of the first bear flag (about a $35K drop), and the incredible rapidity of the correction, the rally we currently have is a long way from matching it. It could be that the price still has a way to go before making that first swing high.
The Stochastic RSI in this time frame is showing that the indicators are perhaps ready to cross back down, but as long as they stay above the 80.00 level there is the chance of squeezing out a bit more upside.
The RSI looks more clear cut, in that the indicator line is nicely above the descending trendline. As long as this continues, the bulls have the advantage.
Bond yields and oil about to subside?
If we add to this that the U.S. 10-year bond yield looks to have made one final spike to the upside, and may well subside from now on, at least from a technical analysis perspective, and that the US WTI oil price could be on the brink of a fall to $84, and perhaps even $68, the scene is perhaps setting for a more benign financial environment for the $BTC price going into the end of this year.
Disclaimer: This article is provided for informational purposes only. It is not offered or intended to be used as legal, tax, investment, financial, or other advice.






Be the first to comment