



What to know:
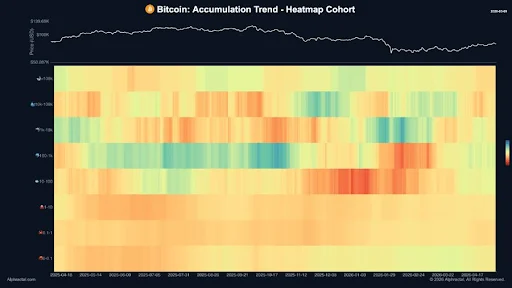
- 78.3% Bitcoin supply in long-term hands, up from 74.1%, roughly 830,000 BTC shifted
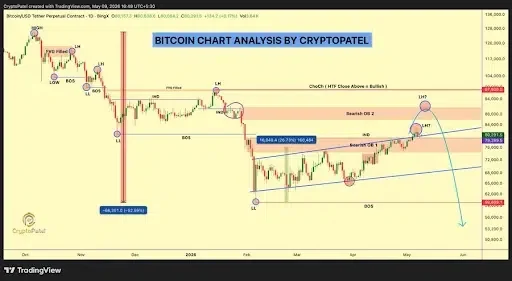
- BTC broke bearish OB 1 $78k–$80k, targets $90k but risk $68k–$60k
- The chart shows resistance at $97k as a key for trend shift.

Bitcoin supply shift analysis shows a clear change in Bitcoin ownership patterns as long-term holders continue to dominate market supply.
According to the data provided, approximately 78.3% of all BTCs have been held in long-term wallet addresses compared to 74.1% in the previous cycle. The report on Bitcoin supply reveals that about 830,000 BTC have exited short-term trader pools.
Also Read: Chainlink Price Prediction: LINK Signals Recovery as $10 Zone Reclaims Momentum

Bitcoin Supply Shift Analysis Shows Long-Term Holding Surge
This phase of the analysis of the Bitcoin supply shift reveals a consistent decline in short-term trade confidence. The long-term wallets continue to absorb supply in relation to price movements, leading to reduced liquidity in the market.
This is typically reflected in a low selling pressure when prices drop, as less currency will be in circulation.

Source: X
Another way that this can be illustrated is through data that suggests this development is among the largest observed in recent times. Currently, the dynamics of Bitcoin supply shifts indicate a trend of hoarding rather than trading.
Short-Term Market Structure and Key Levels
In the near term, prices will move beyond the bearish price area of $78,000 to $80,000 that is now a support level. This support level remains crucial in maintaining momentum in favor of the bulls.
In case this support level is successful, prices will move upwards towards the $90,000 resistance level. The level of $82,000, which will be rejected, may force the price to reverse to around $68,000 if there is strong selling pressure.
Furthermore, in addition to analyzing the changing dynamics of the BTC supply distribution, one should highlight the fact that the liquidity zones become tighter; hence, more volatility at the crucial levels may be expected. If the price cannot remain above $78,000, the current bullish scenario will not hold true.

Source: X
Higher Timeframe Signals Mixed Momentum
In the higher time frames, the BTC price trend continues to be corrective after reaching an all-time high at $120,000. Lower highs and lower lows have been seen despite some intermittent rallies.
In the supply shift model, the price is also found to be below the resistance level at $97,000, thus indicating unclear momentum in the long term.
Two significant supply areas between $79,000 and $94,000 continue to provide resistance for the price action. A rally channel has been established from the liquidity zone at $59,000.
Also Read: Ethereum Institutional Accumulation Surge Accelerates with $16B in Corporate Holdings



Be the first to comment