


In brief
- Bitcoin remains range-bound, trapped in a death cross, with all the signs of a bear trap in the making.
- Zcash, meanwhile, is painting the opposite picture, with indicators lending credence to a recovery underway.
- But neither shows a confirmed trend with conviction yet. Here’s why.
It was a quiet crypto trading session in a quiet summer, but the charts are painting different pictures for Bitcoin, the market leader, and Zcash, one of the hottest altcoins of the last year.
Bitcoin spent the week dealing with fears of quantum and AI threats: CNBC’s Jim Cramer said he’s dumping his BTC over quantum-computing fears, and a separate $130 million Coldcard wallet exploit, disclosed late last week, added a custody scare on top.
On the macro side, the Federal Reserve, holding rates at 3.5%–3.75%, left risk assets in a wait-and-see limbo.

Zcash, the privacy coin co-created by NSA whistleblower Edward Snowden, had a firmer reason to move. Its Ironwood upgrade, network upgrade NU6.3, activated on mainnet July 28 at block 3,428,143, reworking the network’s privacy backbone. It was no small thing, given the update put to rest fears created when, again, AI discovered a vulnerability in Zcash’s code that’s now been patched.
Zcash, which trades as ZEC, dipped on the activation of the upgrade, a classic sell-the-news scenario, before buyers came back. Tuesday’s 2.95% gain for ZEC keeps that recovery narrative alive.
Bitcoin price: What the charts say
Bitcoin printed a $63,820–$64,706 price range and is currently priced at $64,656, up 0.94%. The move looks like a recovery attempt, not a trend reversal.
The bigger picture sets the trap. Bitcoin peaked near $80,000 in May, crashed through June to a low near $56,000, and has since stabilized in a $60,000–$67,000 range through July and early August. That is a base, not a breakout.
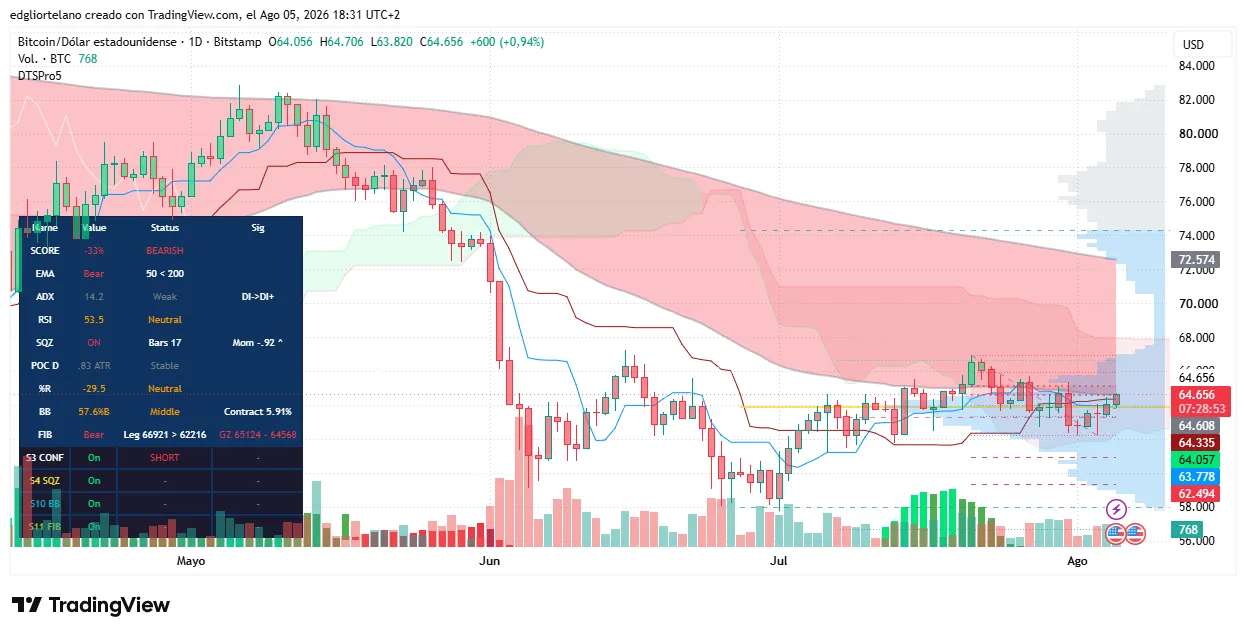
The price of Bitcoin is now pressing toward the 200-day exponential moving average, or EMA, around $66,500, the ceiling that has capped every bounce since a pattern traders refer to as a death cross formed months ago. The structure still reads like a relief rally inside a downtrend: higher from the June low, but not yet able to reclaim the long-term average.
The 50-day EMA (the average price of the last 50 days) sits near $64,200, below the 200-day EMA near $66,500, in a death cross formation. A death cross occurs when the shorter average sits below the longer one, so the medium-term trajectory is still pointed downward. Current BTC price is above the 50-day but below the 200-day, a short-term recovery pressing into long-term resistance.
The Relative Strength Index, or RSI, a momentum gauge on a 0–100 scale where above 70 is overbought and below 30 is oversold, reads 53.5, just above the neutral 50 line. Neutral to slightly bullish, but not convincing.
The Squeeze Momentum indicator is on, showing that something is loading. Squeezes tend to resolve in the direction of the prior trend far more often than they reverse, so the coil is leaning against the rally. The Average Directional Index, or ADX, reads 14.2, weak, with negative directional pressure. Sub-24 readings mean no confirmed trend is in place, and false breakouts are common.
Resistance is the 200 EMA near $66,500, then the leg high at $66,921. Bulls need a daily close back above that area to confirm the squeeze can fire upward. On the downside, losing $64,057, the golden-zone low, opens $63,778 and then the round $56,000 shelf that marks the June bottom. A run at $66,500 that fails would be a textbook bull trap.
Zcash price: What the charts say
Zcash today told the more constructive story. It currently trades at $520.33 and a roughly $8.7 billion market cap, up 2.95%, after tagging a $525.00 high and a $502.98 low. The price of ZEC has spiked more than 5% in the last 24 hours.
The trajectory backs it up. Zcash went parabolic from roughly $300 to a peak near $680 between April and early June, then crashed violently to around $480 in mid-June.
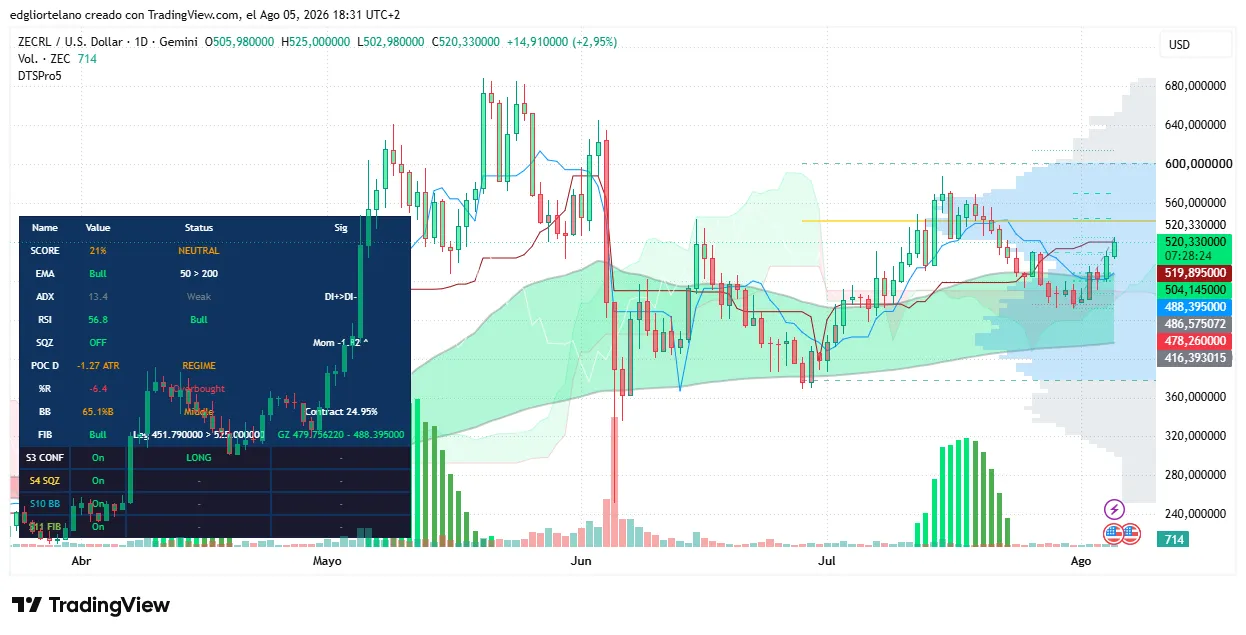
Since then, it has recovered to $560 before pulling back to the current $520. That is a recovery that has not rolled back over: price holds above both moving averages, and the April–June damage has been digested rather than repeated. The recent dip from $560 to $520 looks like a pullback inside the recovery, not a fresh downtrend.
The 50-day EMA sits at $504.15, above the 200-day EMA at $488.40, a golden cross, the bullish inverse of Bitcoin’s death cross. Zcash’s current price is above both, so the medium-term trajectory points up. RSI reads 56.8, in bullish territory but not stretched. The Squeeze is off, so there is no coil building, just a steady grind. ADX is 13.4, weak, which means the recovery lacks conviction and can still chop. Price is pressing into the $525 leg high, the ceiling of the current move.
Resistance is set around $560 and $600, with the April peak near $680 beyond. A clean break of $525 confirms the recovery leg; failure there likely fades back to the $504.15 50 EMA. Below that, the $488.40 200 EMA and the $479.76–$488.40 golden zone are the floor, with $478.26 and $416.39 beneath.
The bull case for Zcash is real but not yet confirmed: a close above $525 extends the recovery toward $560, and Bitcoin reclaiming $66,500 would drag the whole complex higher. Both need conviction the technical indicators aren’t giving.
Right now, Bitcoin is testing a ceiling it has failed to hold for months, and Zcash is holding its stack but running into its own.
Disclaimer
The views and opinions expressed by the author are for informational purposes only and do not constitute financial, investment, or other advice.
Daily Debrief Newsletter
Start every day with the top news stories right now, plus original features, a podcast, videos and more.



Be the first to comment