


The Bitcoin market has entered a forced consolidation phase following the rejection at levels above $66,000. As of the close on August 5, BTC trades in the $63,000 to $64,000 range, substantially below the cycle high of $126,200 recorded in October 2025. The central question dominating short-to-medium term analysis is not whether the market will correct, but the depth of the correction and the catalysts that will trigger it.
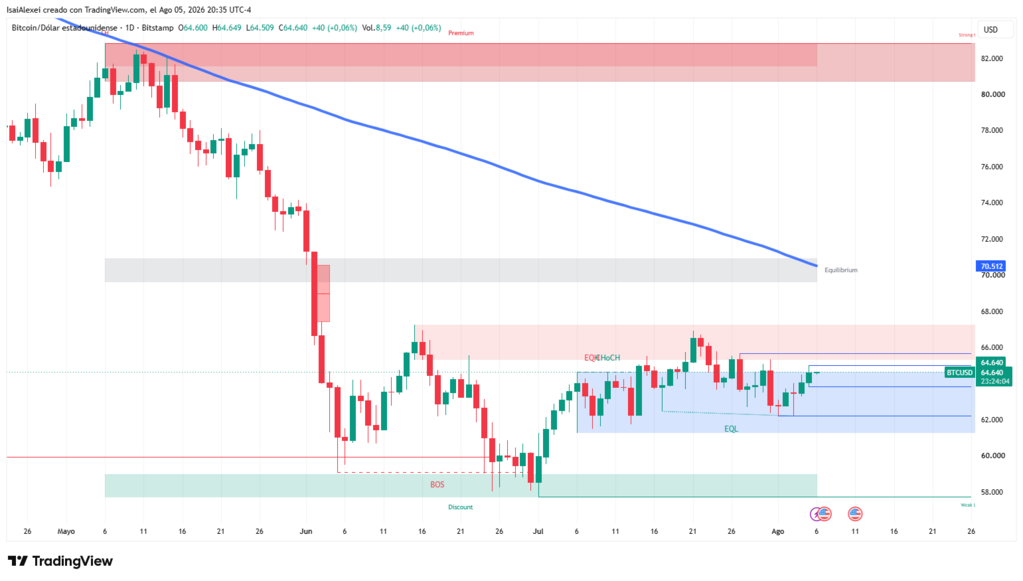
Three sets of signals —technical, on-chain, and macroeconomic— converge into a scenario of increasing pressure on the price. A disaggregated analysis of each set permits an evaluation of the probability that BTC maintains support at $60,000 or, alternatively, initiates a corrective move toward the $52,800 zone.
Moving Average Convergence and the Reversal Pattern
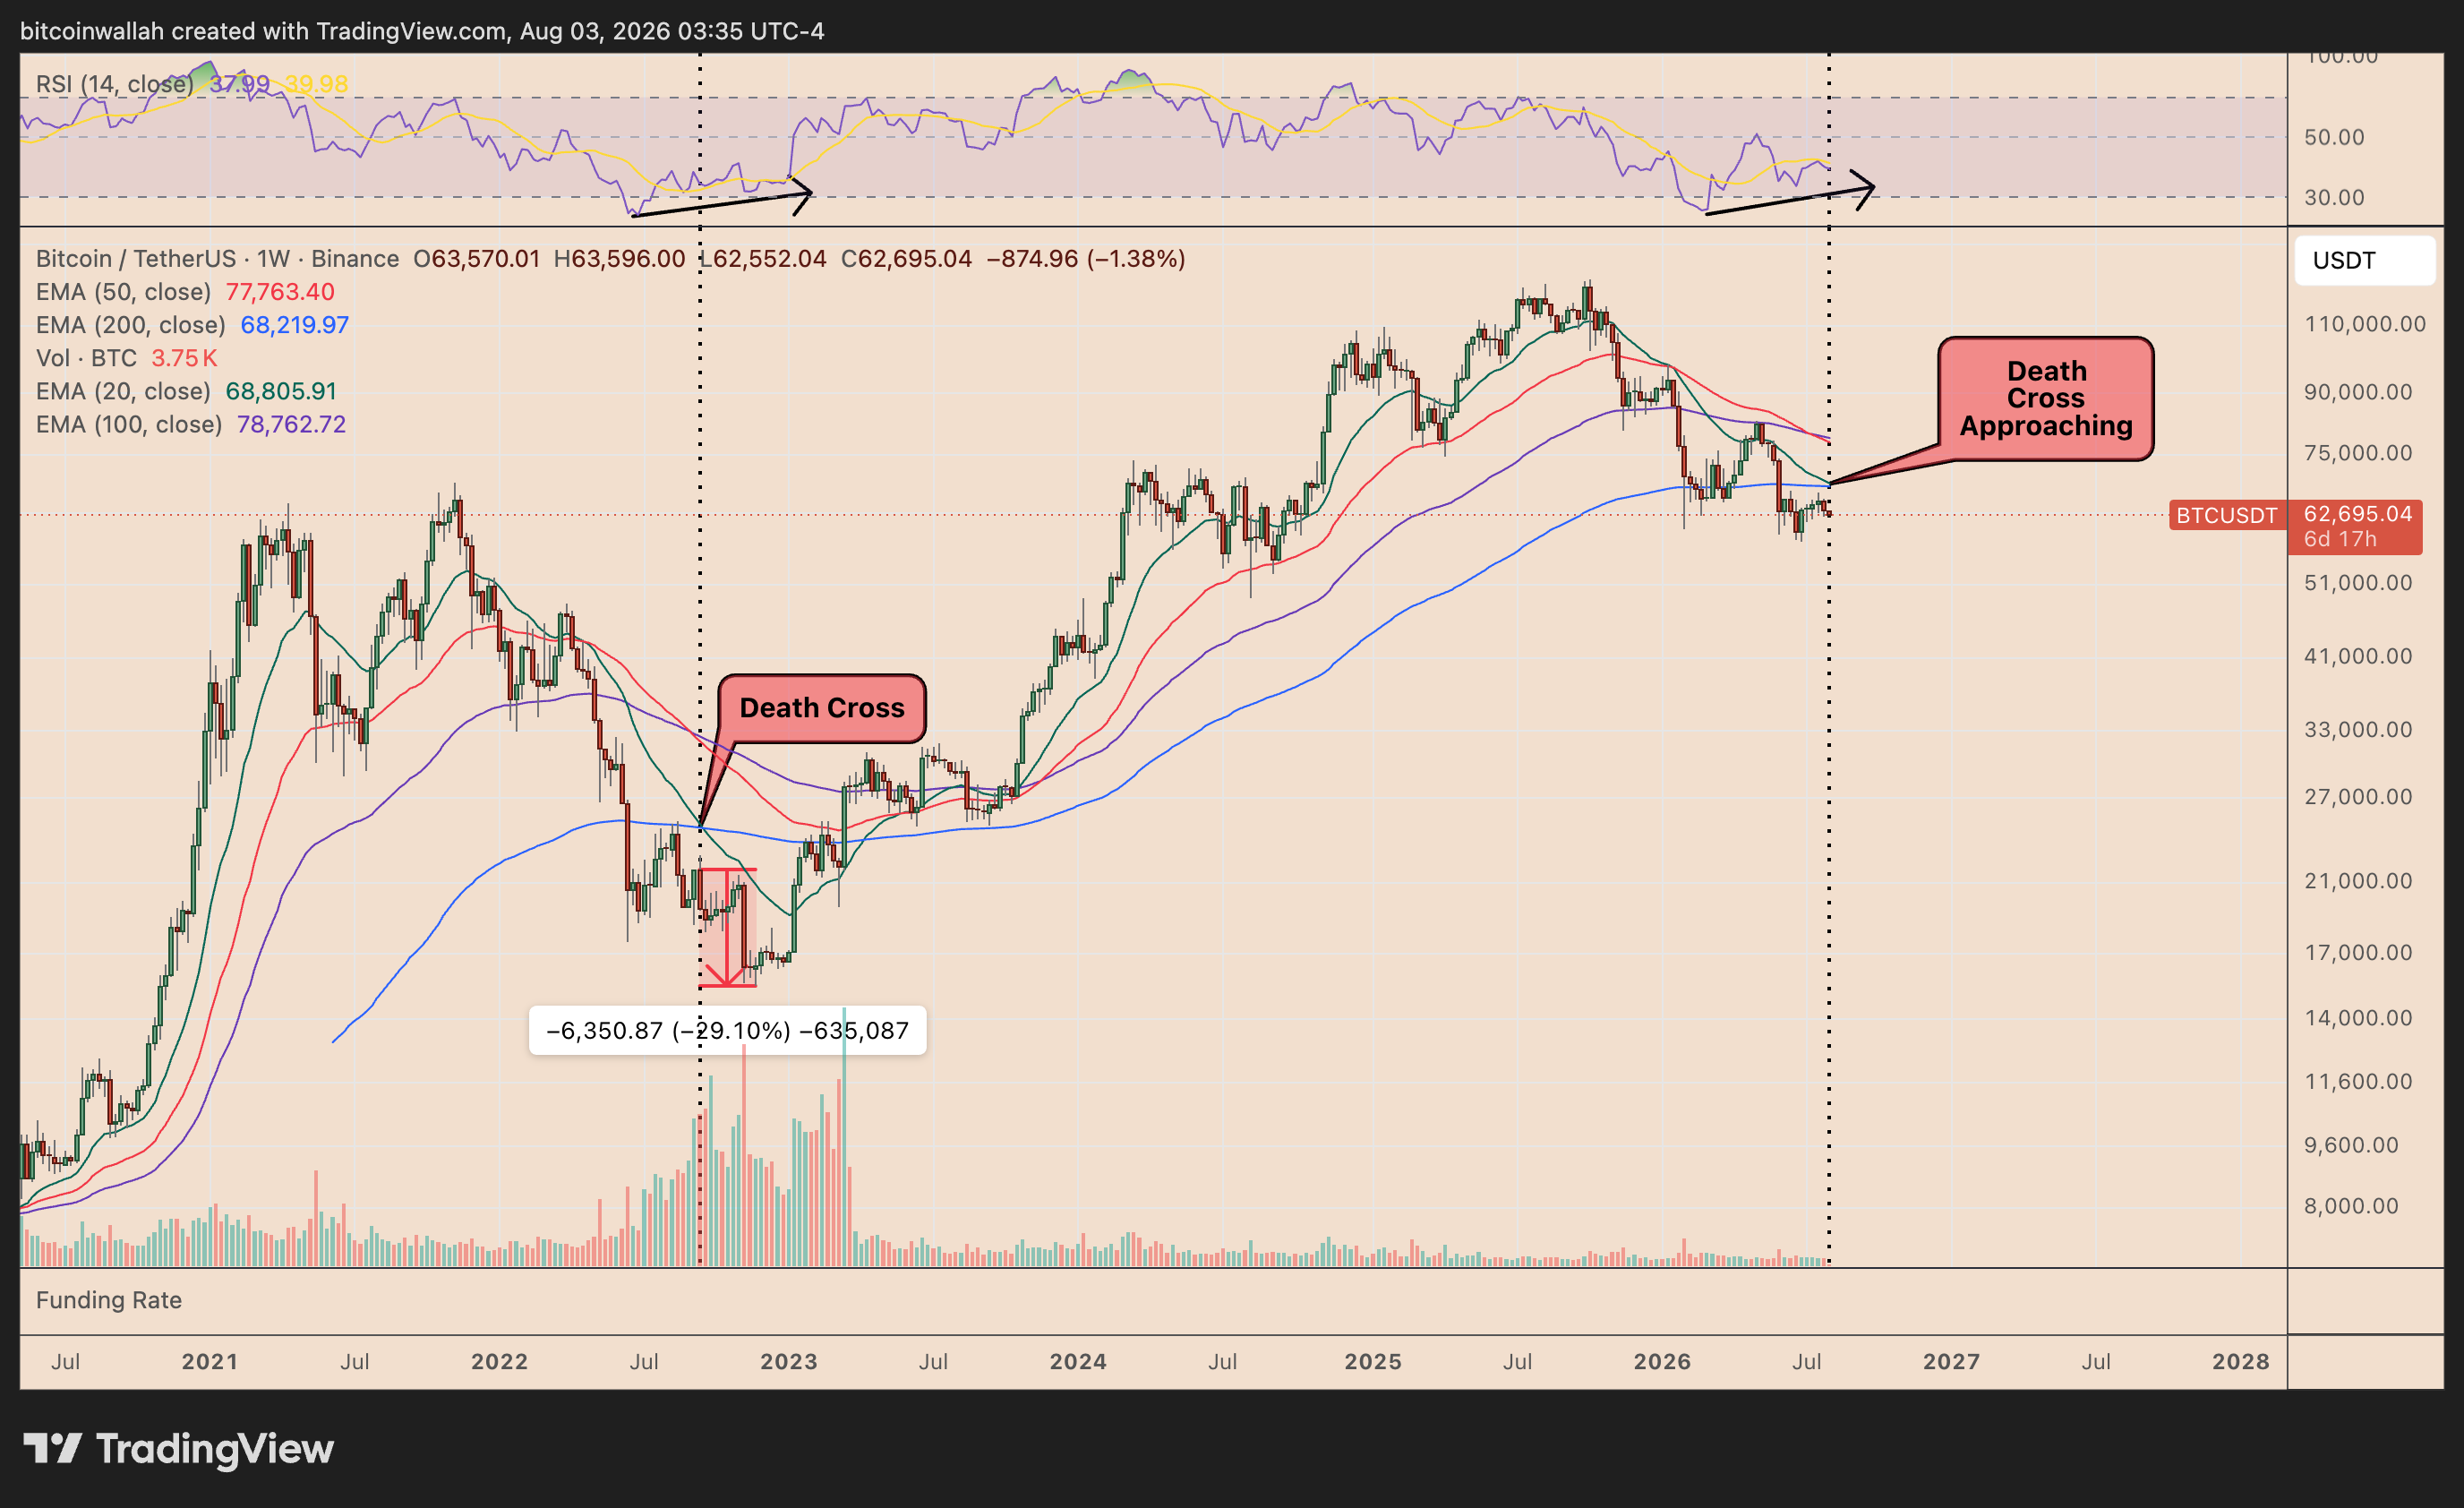
The most relevant indicator on the technical front is the proximity of a “death cross” on the weekly chart. As of August 3, the 20-week exponential moving average (EMA-20) stood at $68,806, merely $586 above the EMA-200 at $68,220. The convergence of both averages indicates that short-term momentum is about to position itself below the long-term trend, an event that in December 2022 preceded an additional 29% decline in the BTC price.
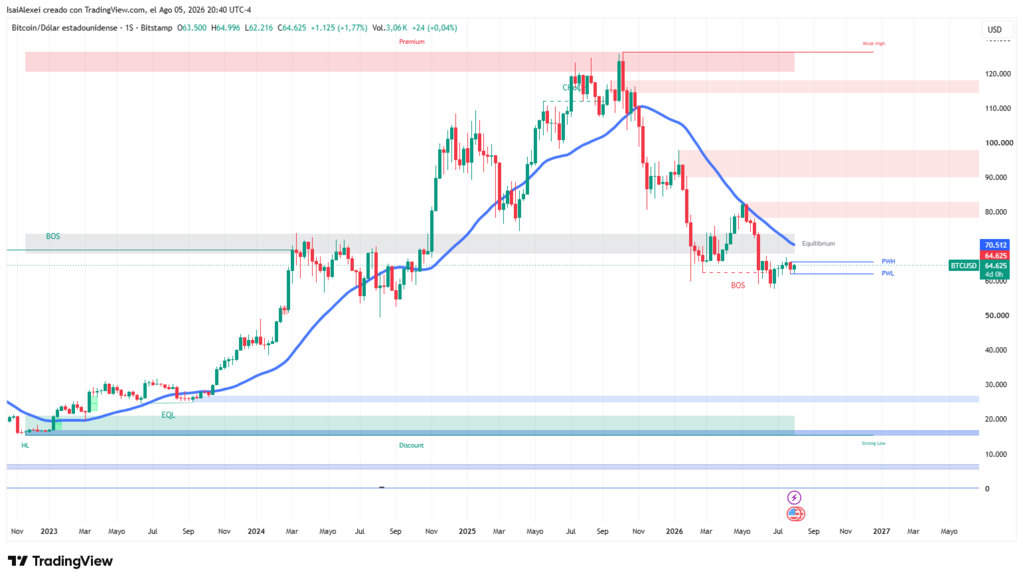
This cross, while not constituting an infallible predictor, gains relevance when combined with the formation of an “inverse cup-and-handle” pattern. This structure has developed over several months: a rounded dome between $59,000 and $82,000, followed by a narrow ascending channel representing the handle. A decisive close below the lower trendline of the handle, located in the $59,000 to $60,000 zone, would confirm the bearish breakdown and project a price target near $44,400.

On the intraday front, the price remains below both weekly EMAs, operating approximately 9% below said technical formation. This suggests the market is already discounting, at least partially, the bearish scenario. However, the critical support zone is located at $60,000, a level that has acted as a defense line on multiple occasions during the third quarter. To the upside, the key resistance sits at $65,000, a break above which would be necessary to invalidate the short-term corrective scenario.
Trading volume has shown a 71% increase over the last 24 hours, reaching $26.93 billion. This volume increase in a context of sideways price action suggests accumulating pressure on both sides of the order book, which anticipates a higher-amplitude movement in the short term.
On-Chain Signal: Holder Stress and Defensive Positioning
Blockchain data reinforces the thesis of price pressure. The UTXO (unspent transaction output) stress index for Bitcoin has climbed to 71.58, exceeding the critical threshold of 70. This indicator measures the proportion of the circulating supply that is in loss; a value above 70 implies aportion of holders is under financial pressure. For context, approximately one year ago this same indicator stood at 41, reflecting a neutral outlook.
On-chain analyst Axel Adler Jr. has noted that the weekly momentum of the indicator has turned positive with a +3 increase, suggesting that stress and selling pressure are increasing again. If BTC falls below its monthly low of $61,500 and the stress index surpasses 90, selling pressure would intensify. Conversely, a drop of the index below 70 with negative momentum would alleviate said pressure.
In parallel, the proportion of Bitcoin supply in profit remains at 52% according to CryptoQuant data. This level has historically been an inflection point in bear cycles: during each deep correction, the proportion of profitable supply tends to stabilize near 50% before initiating a new accumulation phase. The fact that this indicator briefly fell below 50% in June and July, albeit without a sustained dominance of loss-making positions, suggests the market is in the final stage of the bearish cycle.
However, the market being in the final phase of a bearish cycle does not imply an absence of downside risk. Glassnode reports that overall market profitability continues to decline, with the profitable supply ratio approaching a cyclical low. Investor spending behavior has become more defensive, reflecting stop-loss strategies. Spot demand is described as weak, and the derivatives market maintains a defensive posture, with the 25 Delta skew widening as a signal of increased demand for downside protection.
The options market adds an additional element of pressure. An anonymous whale sold $173 million in call option contracts, betting that the BTC price will not exceed $70,000 before September 25. This operation, which would yield a premium of $3.03 million if the price remains below the strike price, reflects a bearish or neutral view from at least one large market participant.
Macroeconomic Signal: Yields Rising and Carry Trade Reversal
The macroeconomic environment constitutes perhaps the most structural pressure factor on Bitcoin. The yield on the 30-year U.S. Treasury bond has exceeded 5.28%, reaching its highest level since 2007. This movement, which reflects expectations of persistent inflation and fiscal concerns, has diverted capital from risk assets toward risk-free assets.
The magnitude of the impact is evidenced in capital outflows from U.S.-listed crypto exchange-traded products: $265.37 million were withdrawn from Bitcoin-linked products in a single session. Analyst Benjamin Cowen anticipates that the 10-year Treasury yield could reclaim the 5% level in the short term, a move that, according to his analysis, would eventually pressure the Federal Reserve toward a rate hike.
Fed funds futures markets are already assigning a 64.6% probability to a 25-basis-point hike in September. A rate hike would further restrict capital flow into risk assets, including cryptocurrencies. This scenario is aggravated by the yield inversion between Bitcoin futures and Treasury bonds: the quarterly basis yield on BTC futures has been below the 2-year Treasury note for 157 consecutive days, eliminating the arbitrage incentive that historically attracted capital to the market.
On the foreign exchange front, the coordinated intervention by Japan and the U.S. in the currency market —the first since 2011 and the first joint intervention specifically to support the yen since 1998— has renewed attention on the yen carry trade. A sustained appreciation of the yen could accelerate the unwinding of leveraged positions funded in yen, forcing investors to reduce exposure to risk assets such as Bitcoin. QCP Capital has pointed out that the USD/JPY exchange rate, the Japanese funding environment, and long-term Treasury yields are becoming significant factors influencing the liquidity of BTC and ETH.
Price Scenarios and Levels to Monitor
The consensus among on-chain analysts places the most probable scenario (55% probability) for August in a range of $57,700 to $67,000, with a monthly close between $60,000 and $64,000. The bearish scenario (30% probability) contemplates a drop below $57,700, with a test of the on-chain realized price at $52,800. The bullish scenario (15% probability) would require a sustained hold above $67,000, supported by continuous ETF inflows, a decline in Treasury yields, and a weaker dollar, with a target of $71,000 to $74,000.
Levels to monitor in the short term include:
-
Immediate support: $60,000 (psychological and technical level)
-
Secondary support: $57,700 (lower boundary of the projected range)
-
Deep support: $52,800 (on-chain realized price)
-
Immediate resistance: $65,000
-
Key resistance: $67,000 (confirmation level for the bullish scenario)
Macroeconomic events in August —U.S. non-farm payrolls (August 7), CPI data (August 12), and the Jackson Hole symposium— constitute volatility catalysts that could tilt the balance toward any of the three scenarios.



Be the first to comment