



On Monday, August 10, the U.S. spot Bitcoin [BTC] ETF flows measured a negative $144.6 million. It broke a streak of positive flows for five consecutive trading days, which had brought in $865.3 million.
At the same time, Bitcoin was also down just over 3% from Sunday’s local high at $65,474. The $65k-$67k is a key supply zone, and the inability to climb past this barrier hinted at bearish control in the market.
The longer-term bearish trend is prevalent in the price charts. The liquidation levels to the south can attract Bitcoin toward $57k, and the turnaround in spot ETF flows was another warning sign.
There was also evidence for compressed volatility. This could make the leading crypto’s price action more interesting in the coming weeks.

Bitcoin could be operating inside the calm before a storm
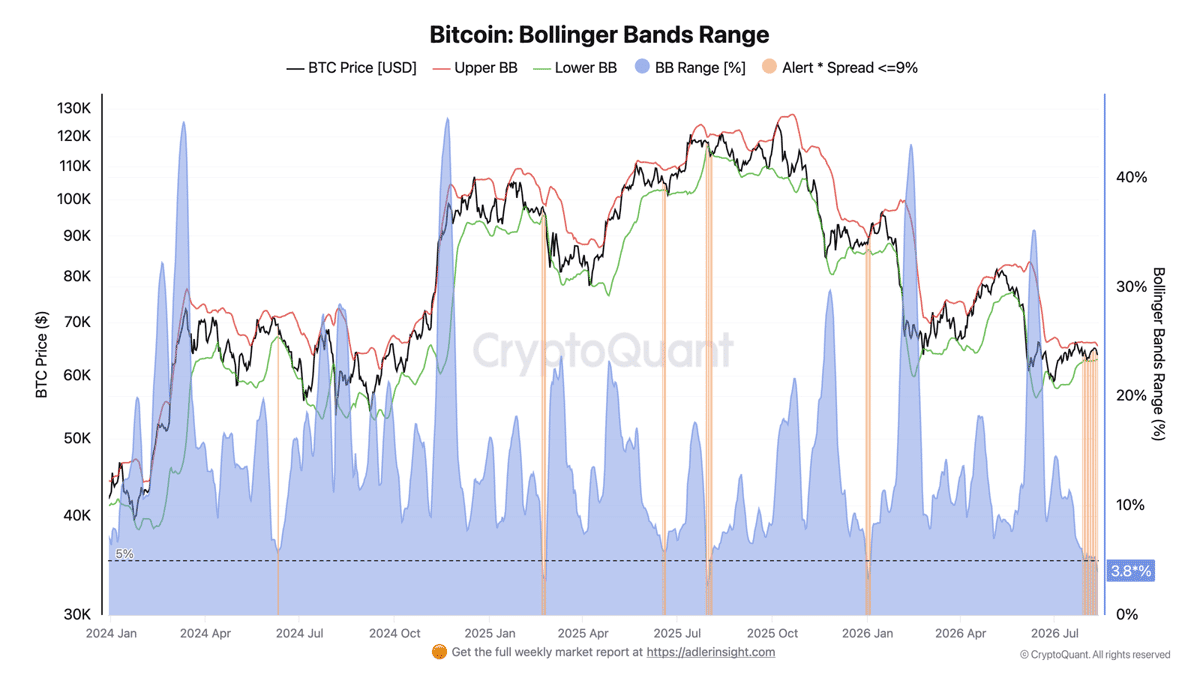
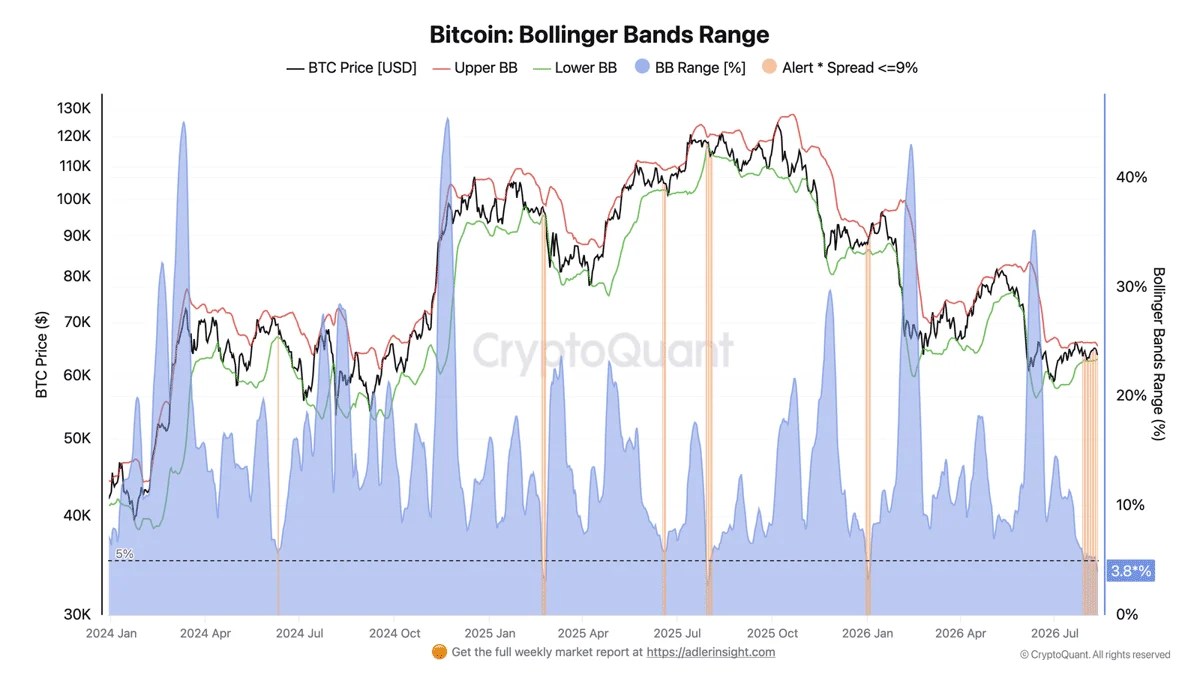
The Bollinger Bands help measure volatility. The tighter the bands, the less the volatility is. The width is currently 3.8%, and it was a warning of strong band compression, according to crypto analyst Axel Adler Jr.
This was some of the lowest readings the metric has shown in two years. Where there is such a sharp volatility compression, a similarly violent volatility expansion tends to follow.
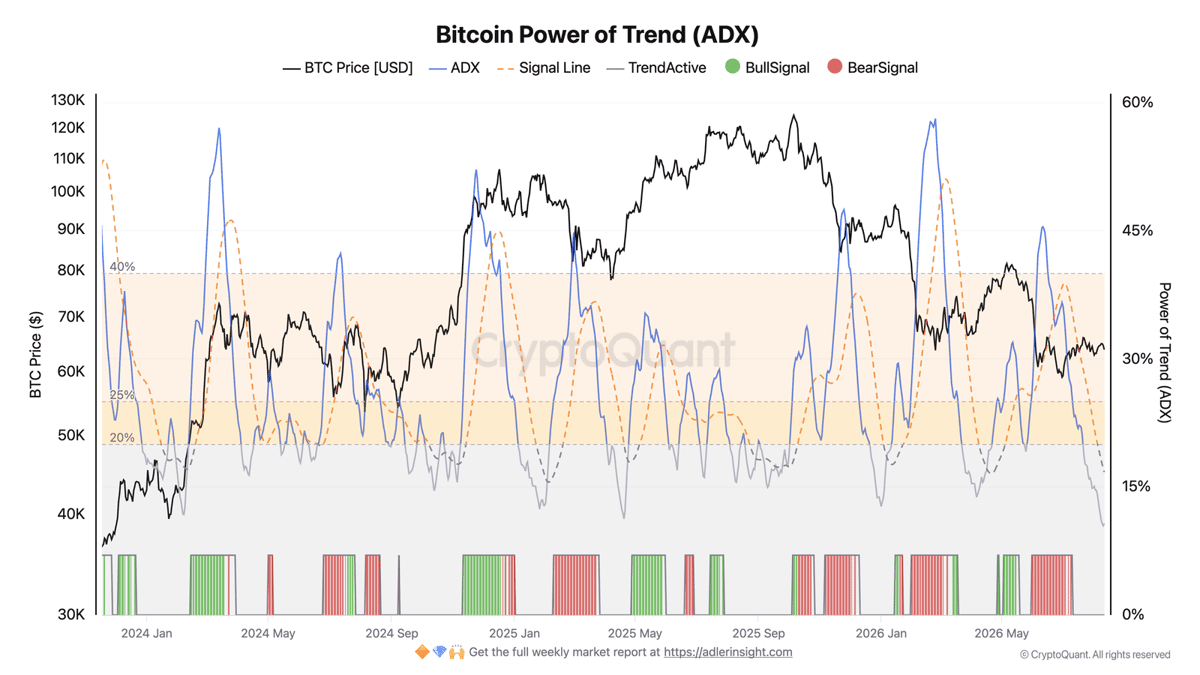

The ADX indicator measures market strength. Its score was at 11, well below the 25 threshold that signals a strong trend is underway. Moreover, the -DI and +DI lines were moving close together, meaning neither a bull signal nor a bear signal was flashing.
The lack of a directional trend and the compressed volatility was a warning for market participants. A strong price move is brewing, but its direction is still unclear.
The argument for a Bitcoin sell-off
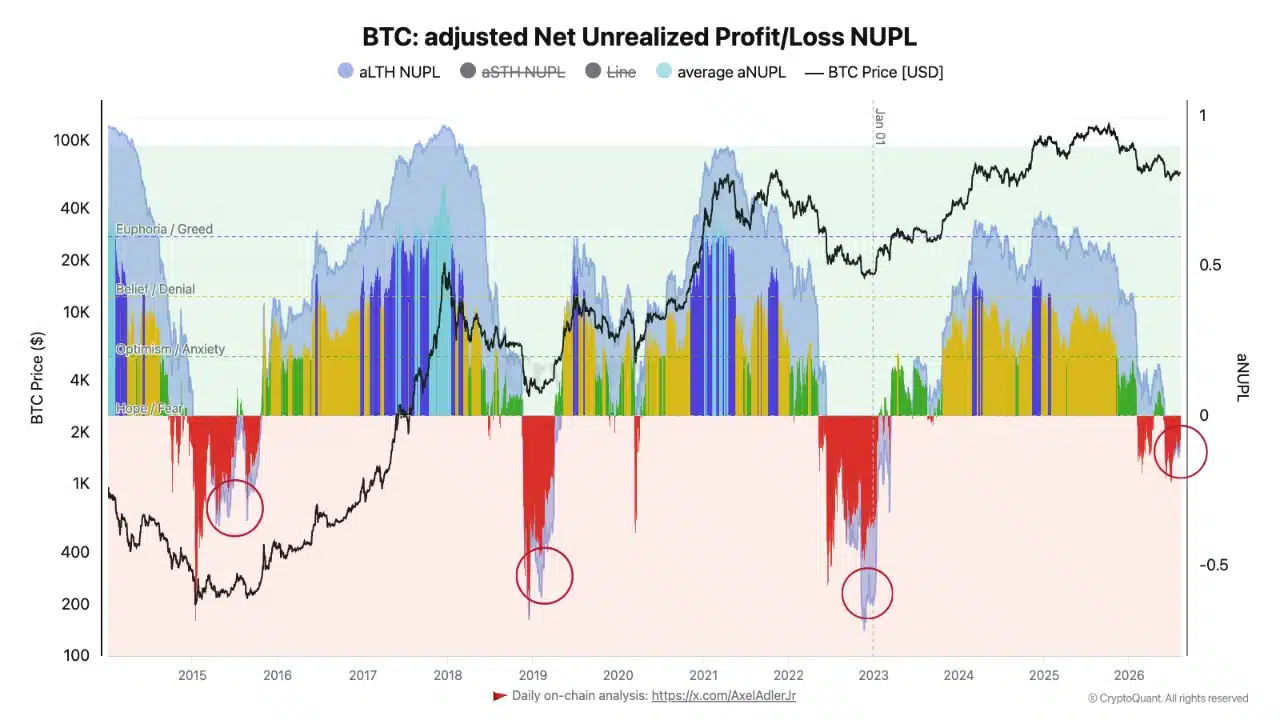
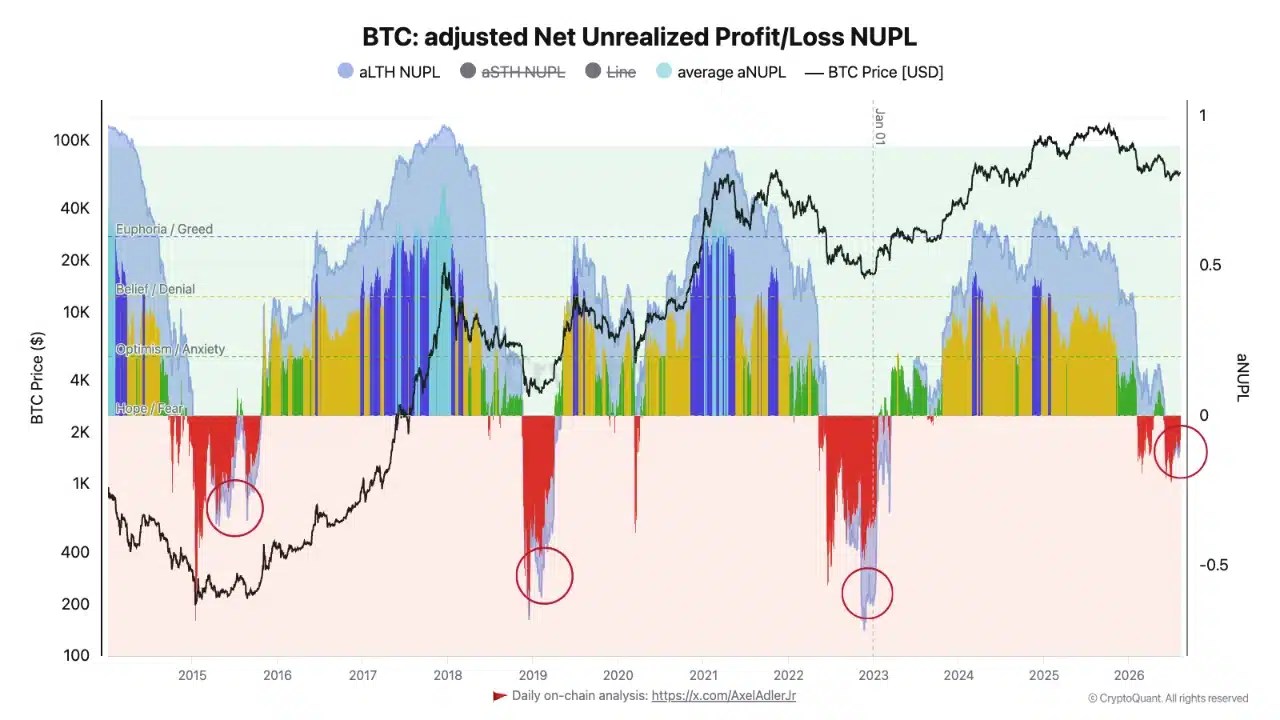
Analyst Moreno used the adjusted Net Unrealized Profit/Loss for Bitcoin to gain insight into the market phase. The metric showed that the long-term holder aNUPL was below the market average and crossed over into negative territory, meaning holders were sitting on unrealized losses.
Previous cycle bottoms have seen the aLTH NUPL fall to much deeper lows. This meant one of two things.
Another severe sell-off is required for the market to reach a bottom. Or, because of institutional investors in the form of corporate treasuries, stronger demand and a more robust holder base have been able to absorb the supply earlier.
If the price falls back below $60k and the aLTH NUPL falls lower, the first case would become more likely. If the metric recovers back toward zero, it could mean long-term holder stress is over.
The direction of the next volatility expansion will settle the cycle bottom debate.
Final Summary
- The compression visible on the Bollinger Bands’ width indicated that Bitcoin was in the calm before the storm.
- The long-term holder stress was rising, but has not yet reached previous cycle depths.



Be the first to comment