



Bitcoin’s monthly chart is repeating its 2022 setup as the CLARITY Act stalls again in the Senate, with key support and volatility levels now in focus.
Under $78,000 is where Bitcoin ended up this week, and the timing wasn’t great, right as the Senate’s CLARITY Act vote hit trouble again. Something else caught traders’ eyes too, honestly, and it’s gotten more attention than the price drop itself.
That monthly chart? It’s tracing almost the same shape it drew back in 2022, right before the last bear market finally found a floor. Not nothing, that.
Same setup once already. Nobody wants to miss it twice.

Why Traders Even Care
Tuesday, Senator Cynthia Lummis said Democrats weren’t budging on the bill’s ethics language, not even after Trump agreed to a second round of concessions, apparently. “There’s nothing left to give,” she told reporters, per CoinDesk. September 15 is when the cloture vote landed on the calendar. Odds of passage dropped by more than a fifth in the hours right after, for what it’s worth.
Whenever it does pass, the CLARITY Act is supposed to set the real federal rulebook for crypto in the US. Bitcoin sells off almost on cue every time those odds slip. Sometimes within minutes of the headline, even. It’s one of the bigger swing factors tracked on LBN’s Bitcoin price analysis hub this month.
The 2022 Chart Rhyme
Twice, back in 2022, Bitcoin got rejected off the top of its range, then dropped hard. A bullish divergence showed up next, on both the weekly and the monthly charts, and Bitcoin rallied straight back to retest that same ceiling. Rejection, drop, divergence, retest, that’s the four-step routine, and the current chart just ran it again. It’s sitting right on that retest candle now, at least at the moment.
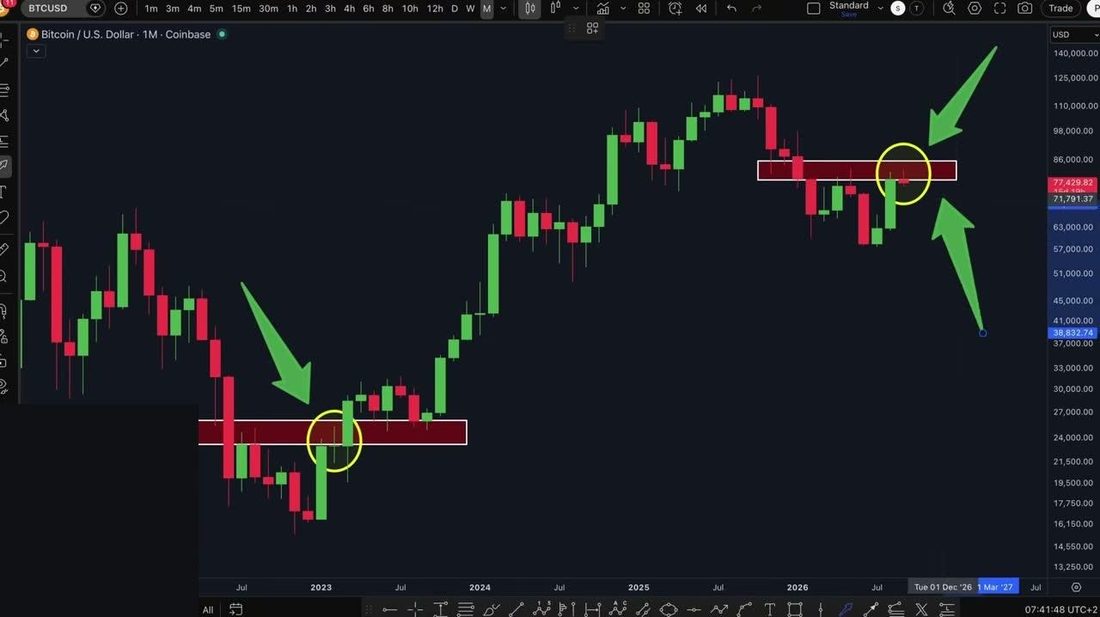
Bitcoin/USD monthly chart, TradingView (Coinbase). Boxed zones mark the 2022 range top against the current range top, both showing the same rejection-then-recovery sequence.
Nobody’s calling it a guaranteed repeat. It probably won’t play out the exact same way twice, if we’re honest. Still, the fractal’s close enough that plenty of chart-watchers are treating $70,000 as the line that decides which way this goes.
Where The Big Orders Sit
The order flow tells its own story, once you zoom into the daily chart. A resistance band’s stacked from the mid-$80,000s up toward $89K, at least according to the Bitget liquidity heatmap. Underneath that, support runs in layers: 72,000 first, roughly, then a thicker band between 68K and 74,000, then another closer to $57,000. Not a coincidence, probably, that a fair value gap near $70.3K lines up almost exactly with that middle band.
That whole zone’s where the “buy the retest” argument actually lives, for what it’s worth.
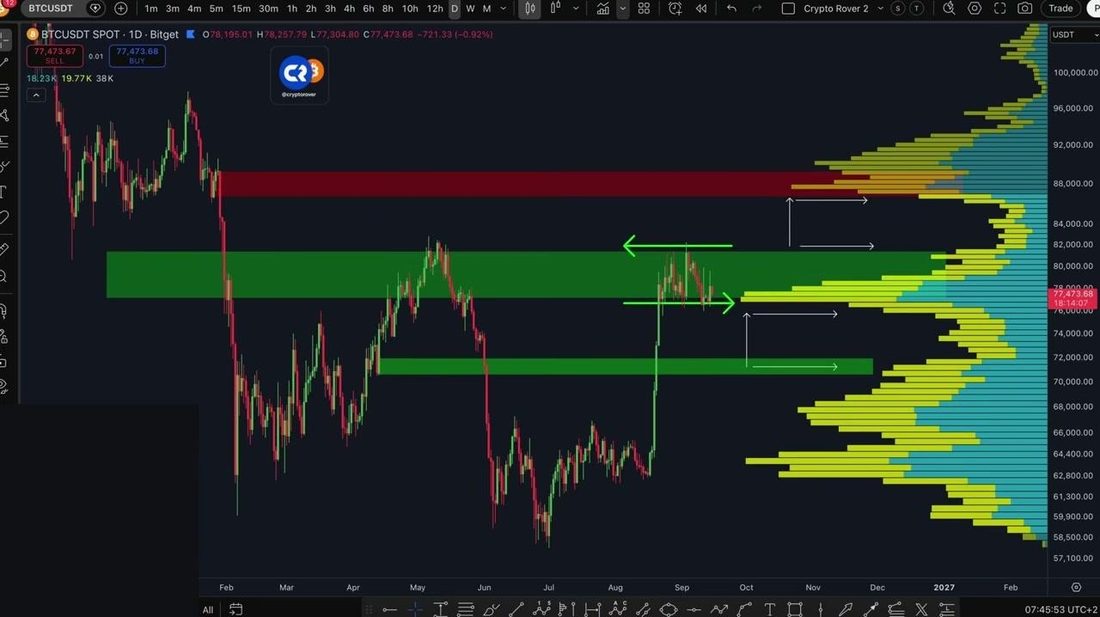
BTC/USDT daily chart with a liquidity heatmap, Bitget. Green bands mark layered support from roughly $72,000 down to $57,000. The red band marks resistance in the mid-to-high $80,000s.
$40,000 gets mentioned occasionally, mostly as the doom scenario. A low-probability tail case is how most of the order-flow argument treats that this week, not the base case. Honestly, Lummis’s comments are a big part of why the near-term chop even exists in the first place.
Volatility Just Hit A Wall
Away from price, the Deribit BTC Volatility Index’s ground down to one of its lowest weekly readings in almost two years. Stretches this quiet tend to end with a sharp move, historically, not more sideways drift.
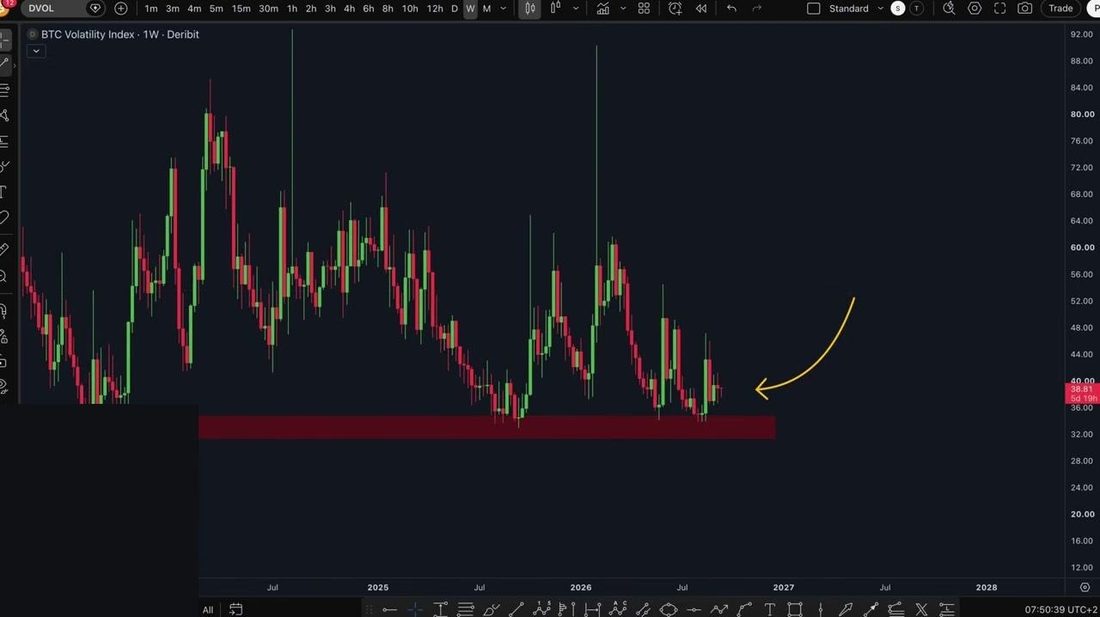
BTC Volatility Index (DVOL), weekly, Deribit. The index has compressed to fresh multi-month lows near 38.
Compression like that? Rarely sits there for long.
Ethereum’s Doing The Same Thing
Inside an ascending triangle is where Ether’s four-hour chart is coiling. Flat resistance near $2,560 to $2,600 caps a rising sequence of higher lows since mid-August. Triangles shaped like that usually resolve as continuation setups, not breakdowns. Whether that holds here’s anyone’s guess, but the structure favors the upside read, for now at least.
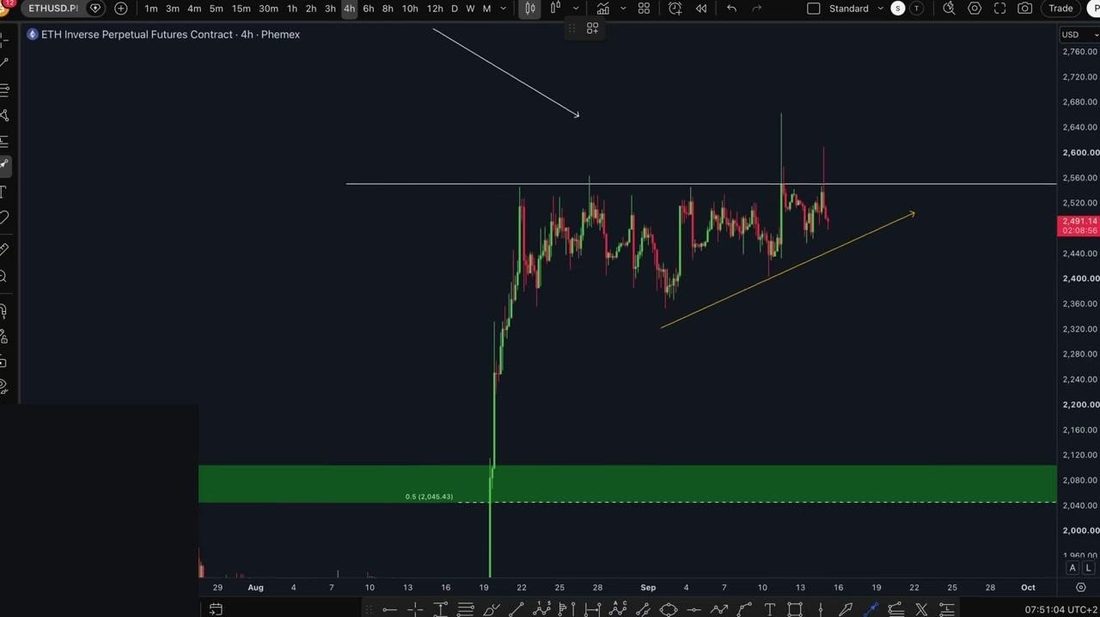
ETH/USD perpetual futures, 4-hour, Phemex. Price is compressing inside an ascending triangle beneath resistance near $2,560-$2,600.
None of this erases the Washington risk hanging over the market this week. Until that bill passes, or gets shelved for good, headline-driven drops like this one are probably just part of the ride, at least for now.



Be the first to comment