


What to know:
- BNB rises to $649 with a 2.75% gain, supported by a 57% surge in volume, signaling bullish momentum.
- Analysts highlight $300–$600 as a key accumulation zone, preceding major rallies and potential breakout opportunities.
- Long-term forecasts suggest potential upside toward $2,000–$10,000 if market momentum continues.

Binance Coin (BNB) is moving in a positive price trajectory following the changing outlook in the crypto market. Furthermore, the BNB price breakout is also supported by its rising volume. According to CoinMarketCap, as of Wednesday, May 6, BNB is currently trading at $649.09, with a 24-hour gain of 2.75%.


Source: CoinMarketCap
BNB Derivative Data Point to Improving Momentum
According to Coinglass, the BNB trading volume surged by 57.04%, reaching $1.09 billion, signaling heightened market activity and stronger participation from traders.

This sharp increase suggests growing interest in the BNB price, potentially driven by volatility, speculative positioning, or renewed confidence in short-term price movements.
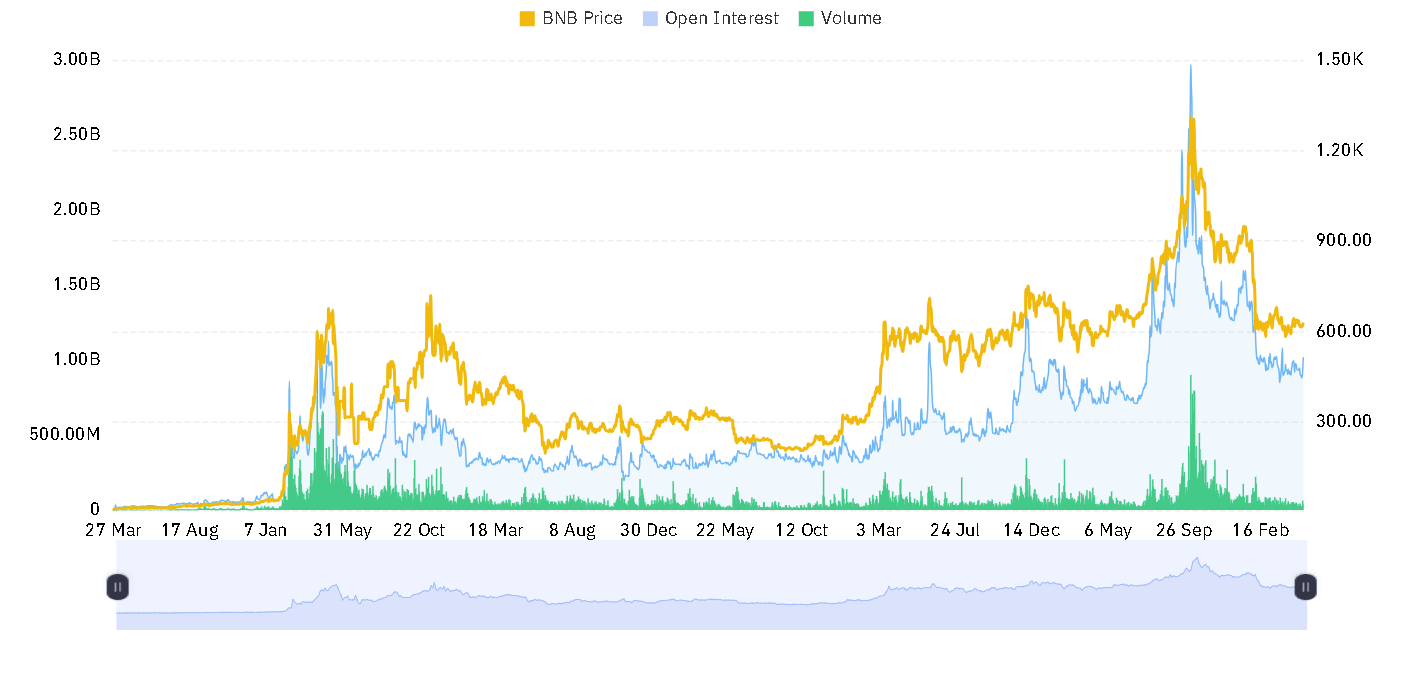

Source: Coinglass
Meanwhile, open interest declined by 3.31% to $994.77 million, indicating a slight reduction in outstanding leveraged positions. This drop may reflect profit taking, position closures, or cautious sentiment as traders adjust exposure amid shifting market conditions.
Also Read: Binance Coin (BNB) Consolidates Above $600: Is a $12,000 Surge Coming?
BNB Price Could Surge to $10,000 in Next Cycle
Furthermore, the crypto analyst Crypto Patel pointed out that BNB is drawing renewed bullish attention as analysts highlight the $300–$600 range as a potential accumulation zone.
Historically, similar quiet phases preceded major rallies, including gains of 660% in 2019 and over 11,000% during 2020–2021, reinforcing the view that low sentiment periods often signal strategic long-term entry opportunities within evolving crypto market cycles affecting BNB’s price.

Source: Crypto Patel’s X Post
For the future, estimates indicate that the BNB price could surge to $2,000-$10,000 if the trend continues.
While supporters believe in awareness and not perfection when considering this currency, there is also an argument about how macro issues and the maturity of the market can limit any further increase in its value.
BNB Technical Indicators Point to Increasing Strength
According to TradingView, the BNB price has plunged from its January highs of about $900, falling to mid-February and bringing its price lower towards $600.
The fall increased the width of Bollinger Bands, indicating greater volatility. Following that, the BNB price has been trying to find support, forming a firm foundation while gradually returning to its 20-day simple moving average, suggesting the beginning of its recovery strength.


Source: TradingView
Since March, the BNB price has been consolidating in a trading range around $620-$680 as the Bollinger Bands tightened, pointing to low volatility. The BNB price remains close to the middle-upper range of the bands, suggesting mild bullish sentiment.
Meanwhile, the MACD is slightly above zero, yet momentum appears to be topping out, suggesting a potential breakout/breakdown move for BNB is imminent.
This article contains market analysis and price predictions. These are not guarantees. Crypto markets are volatile. Always DYOR. Not financial advice.

Be the first to comment