




TLDR
- BNB Chain completed its 37th quarterly burn, removing 1,646,196.44 BNB worth about $1.197 billion.
- BNB trades near $725 to $726, up about 0.5% to 1.2% in 24 hours.
- Total supply now stands at 131,512,085 BNB, about 31.51 million above the 100 million target.
- The daily chart shows BNB below its 20-day moving average of $751.70, with RSI at 41.32.
- Support sits near $700 to $703, while resistance is near $750 to $752.
BNB Chain completed its 37th quarterly token burn on October 19, removing 1,646,196.44 BNB from supply. The BNB Foundation valued the burn at about $1.197 billion. The figures were recorded at 10:05 a.m. UTC.
The 37th quarterly $BNB token burn has been completed directly on BNB Smart Chain (BSC).
~1.64M $BNB has been burned, worth approximately $1.197B USD 🔥
View the details of the burn below 👇https://t.co/sIm4wp4R1Y pic.twitter.com/062alfYcoM
— BNB Chain (@BNBCHAIN) October 19, 2026
The burn took place directly on BNB Smart Chain. It reduced total supply to 131,512,085 BNB.
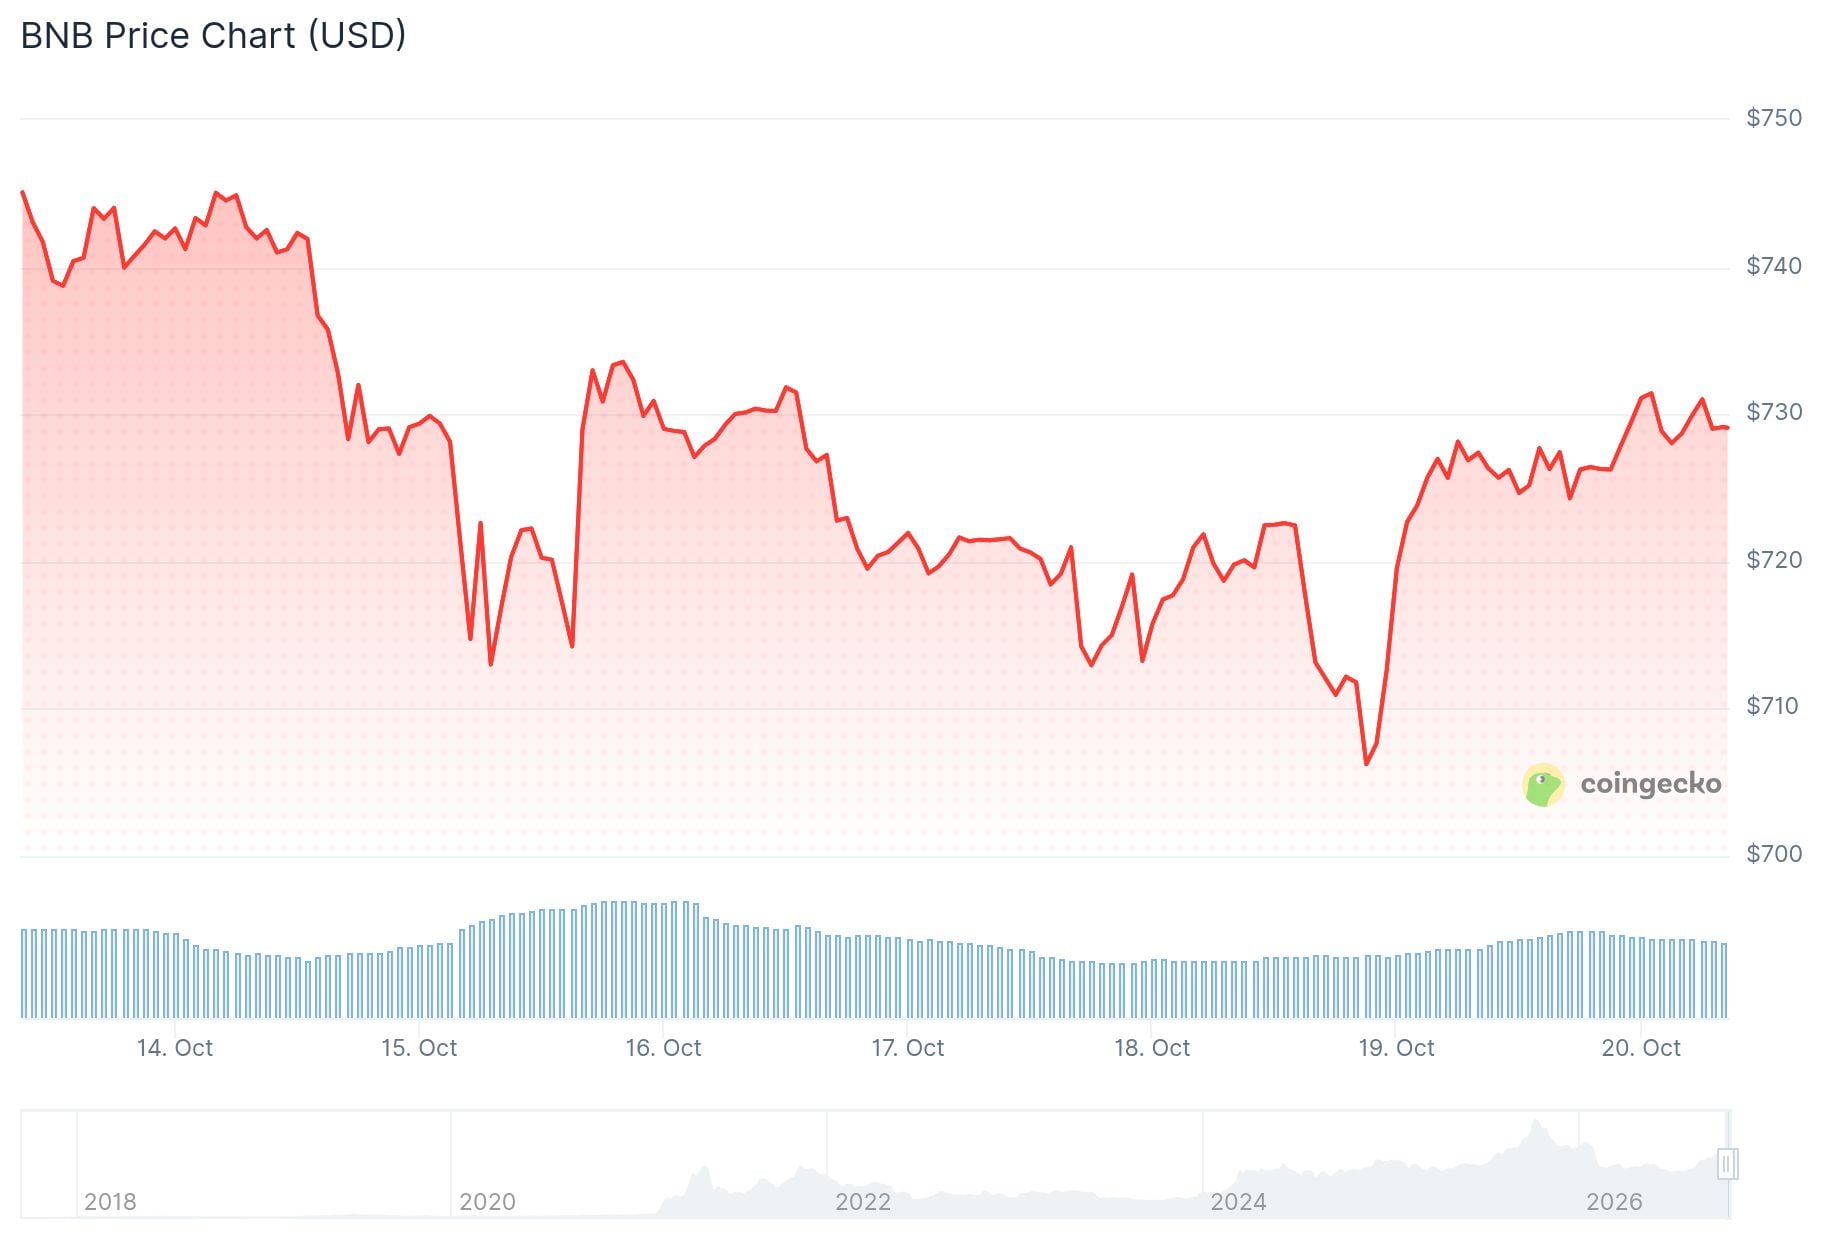
BNB traded near $725 at press time. CoinGecko data shows a market cap of about $95.42 billion, which ranks fourth among cryptocurrencies. Daily trading volume was about $705.68 million.
The October Burn Compared With July
The October burn was larger than the one in July, when 1,615,827.795 BNB, worth about $931.7 million, was destroyed. That is an extra 30,368.645 BNB, a rise of about 1.88% in tokens burned.
The dollar value rose about 28.5%. The difference reflects both the added tokens and a higher BNB price used in the valuation.
The foundation uses an Auto-Burn formula that sets each quarterly amount. It does not depend on the Binance exchange. It is also not a new market purchase of $1.197 billion in tokens.

The foundation said the Lorentz and Maxwell upgrades sped up block production. It adjusted the formula parameters to keep the mechanism working as intended.
The program aims to reach 100 million BNB. About 31.51 million tokens remain above that target. The October burn equals about 1.24% of the supply before the event.
A separate mechanism, BEP-95, burns part of the gas fees on BNB Smart Chain. Validators set the burn ratio through governance. Wu Blockchain noted that the quarterly burn removed about 1.646 million BNB, and said the amount depends on BNB’s price and the number of blocks produced in the quarter.
BNB Price Chart Analysis
The daily chart looks heavy for the bulls. BNB sits under the 20-day SMA at $751.70, closer to the lower Bollinger Band at $702.89. RSI is at 41.32, below its average of 45.04 and the 50 line, so sellers still have the edge after the rejection near $800.
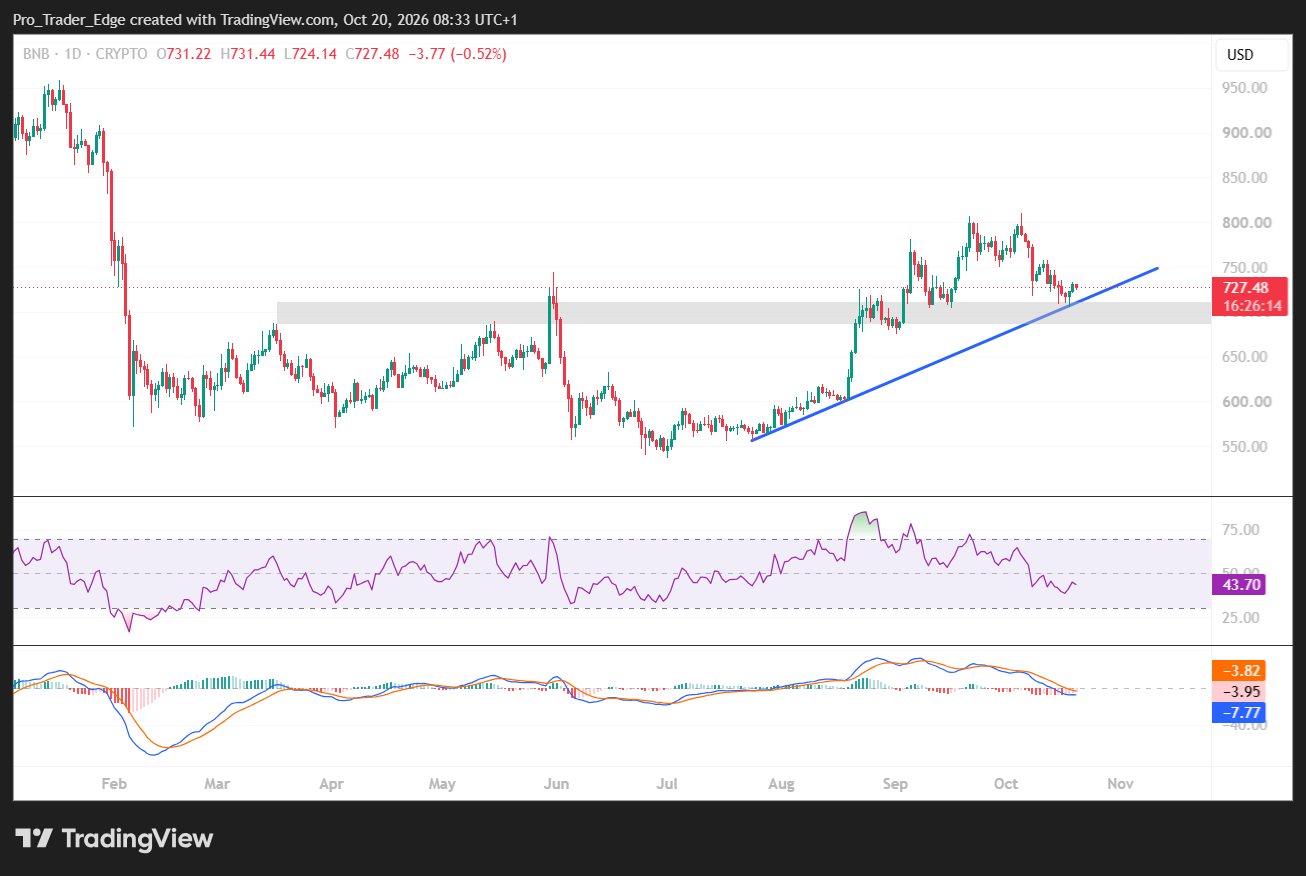
The 4-hour chart looks a bit better. RSI is at 51, and the MACD histogram is positive at 1.75. Price needs a clean push through $730 first. The level to watch next is $750 to $752, where the 20-day average sits. A loss of $720 puts $705 to $710 and then $700 back in play.
$BNB $1600 on the breakout pic.twitter.com/0RGYSsHMhK
— Don 🐂 (@DonWedge) October 19, 2026
Analyst Don (@DonWedge) posted a bullish call on $BNB, setting a target of $1,600 on a breakout.
BNB is down about 3.3% over seven days, according to CoinGecko. The burn has not come with a large rally. The foundation’s release does not measure whether past burns led to price gains.
Bitcoin traded above $82,000 and Ethereum near $2,400. The overall crypto market cap rose 1.2% to $2.74 trillion. BNB was at $728 on one market ticker, up 2.8%.
Below $700, technical levels point to $680 and then $640. Above resistance, the next zone is $780 to $800.


Be the first to comment