


What to know:
- Aave hovers near $105 with rising trading volume ($408M), signaling strong investor interest and renewed market activity
- Analysts highlight a potential bullish breakout if AAVE closes above the critical $108 resistance level on the 4-hour chart
- Technical indicators show strengthening momentum, with RSI rising to 61.66 and price breaking above the 20-period SMA

Aave (AAVE) is moving in an upward price trajectory as BTC has maintained its position above the $74K level, boosting the overall market, including altcoins. According to CoinMarketCap, the AAVE price has surged by 6.86% over the last 24 hours and 12.31% over the last week.
At the time of writing, AAVE is trading at $105.17, with a trading volume of $408.06 million, which has surged by 14.6% over the last 24 hours. However, its market capitalization stands at $1.61 billion, which has surged by 6.86%.

Source: CoinMarketCap

Also Read: Aave Price Eyes 21% Surge Amid Fear
AAVE Could Break $108 to Reverse the Trend
Furthermore, the crypto analyst Alpha Crypto Signal highlighted that AAVE is showing a technically important setup as buy-side liquidity builds beneath current price levels, suggesting strong interest from buyers at lower ranges.
The asset is approaching a defined demand zone where historical support has previously triggered rebounds. Traders are closely watching this area for potential accumulation and limit-based long positioning opportunities.
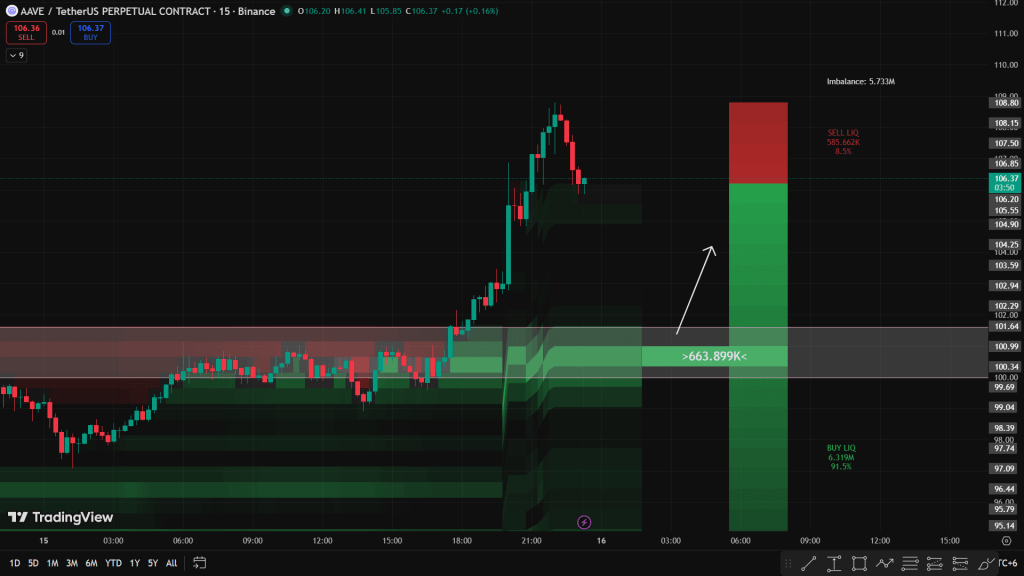
Source: Alpha Crypto Signal’s X Post
The verification of a bullish trend continuation lies in a close price above $108 in a 4-hour candle.
The breakout would mean that bulls have gained an upper hand over the market structure and have been able to push away bears’ selling pressure. With this breakout confirmed, AAVE may be ready for new highs.
AAVE Technical Outlook Points to Improving Strength
According to TradingView, there is an obvious bullish turnaround in AAVE from the sharp low point seen in April.
Price movements have broken through the 20-period moving average line and are now testing the upper Bollinger band at around $105. This is an indication that there may be a turn of events in favor of the bulls.

Source: TradingView
RSI confirms this trend by jumping up to 61.66 and crossing its signal line. It shows that buyers’ interest is intensifying, but the overbought level is not achieved yet.
Although the asset is trading at the upper line of Bollinger bands, it is important for AAVE to remain above the critical support level of $94.71.
This article contains market analysis and price predictions. These are not guarantees. Crypto markets are volatile. Always DYOR. Not financial advice.
Also Read: AAVE Rally Accelerates as Technical Indicators Signal Potential Move to $150
Be the first to comment