

What to know:
- JASMY turned bearish after a failed breakout, falling below the 20-day SMA and signaling a weaker short-term trend.
- MACD bearish crossover and expanding Bollinger Bands confirm strong selling pressure and downside momentum.
- Rejection at key Fibonacci levels (0.5 and 0.382) signals loss of bullish structure, with $0.00585 as next support.

JasmyCoin (JASMY) price action turned bearish after a failed breakout and rejection from key Fibonacci levels, falling back below the 20-day SMA. Technical indicators like MACD and Bollinger Bands confirm strong downside momentum for the JASMY price, while declining open interest and trading volume reflect reduced participation and weakening market sentiment. According to CoinMarketCap, JASMY is trading at $0.005907 with a daily decline of 2.31%.

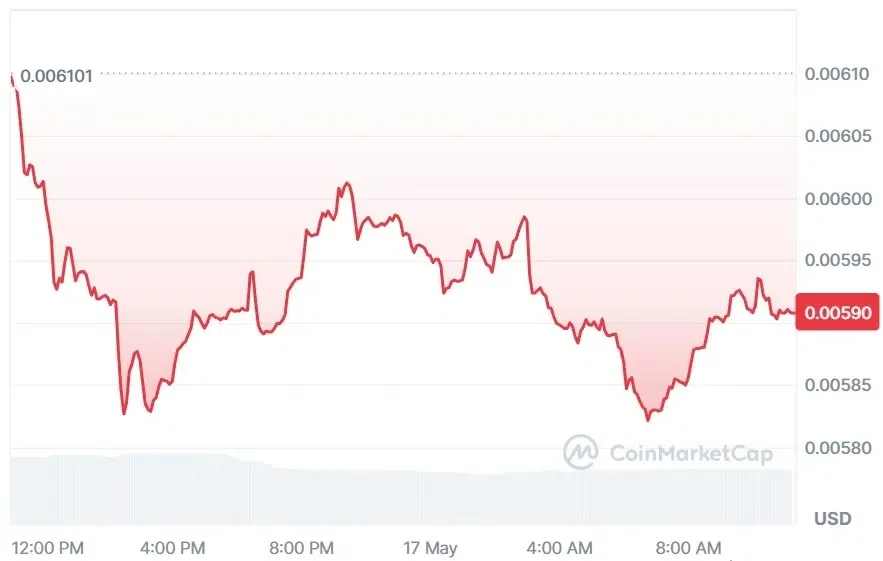
Source: CoinMarketCap
JASMY Derivative Data Reveal Bearish Pressure
According to Coinglass, the JASMY open interest decreased by 20.02%, falling to $20.65 million, indicating reduced derivatives positioning and declining speculative exposure in the market. This suggests traders are becoming more cautious, with fewer active contracts and weakening sentiment across the market.

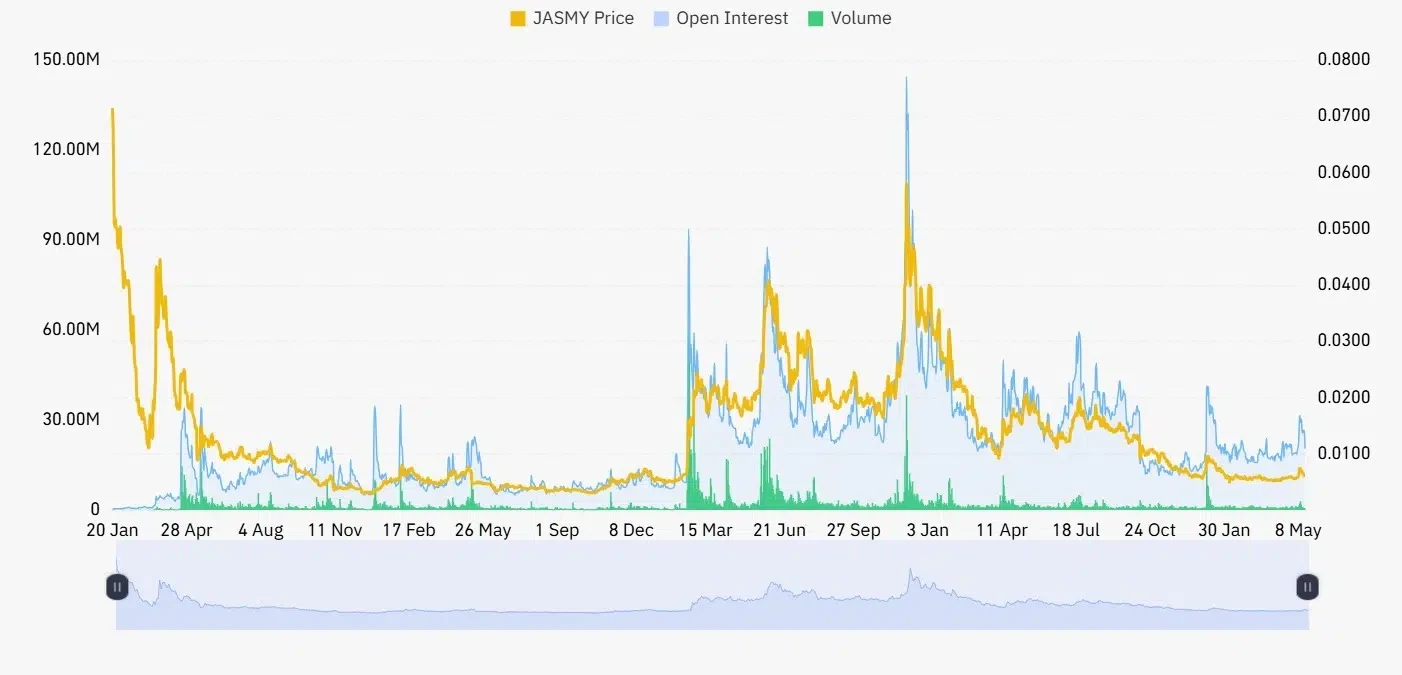

Source: Coinglass
Trading volume declined by 12.39%, reaching $20.75 million, reflecting reduced market activity and lower participation levels. This suggests weakening momentum among traders and decreased engagement in the market compared to prior periods, indicating a slowdown in trading interest.
Also Read: JASMY Price Targets $0.0099 After an Explosive Breakout Above $0.006
JASMY Price Slides Below Critical Fib Zones
Furthermore, the data from The JASMY Empire suggests that the JASMY price starts losing power after an extensive Fibonacci retracement from its peak at $0.01 towards cycle lows.
The failure of the 0.5 level at $0.00736 is immediately followed by rejection beneath the 0.382 level at $0.00668. If the JASMY price move continues lower, attention turns towards the 0.236 level at $0.00585 for the next probable area of reaction.
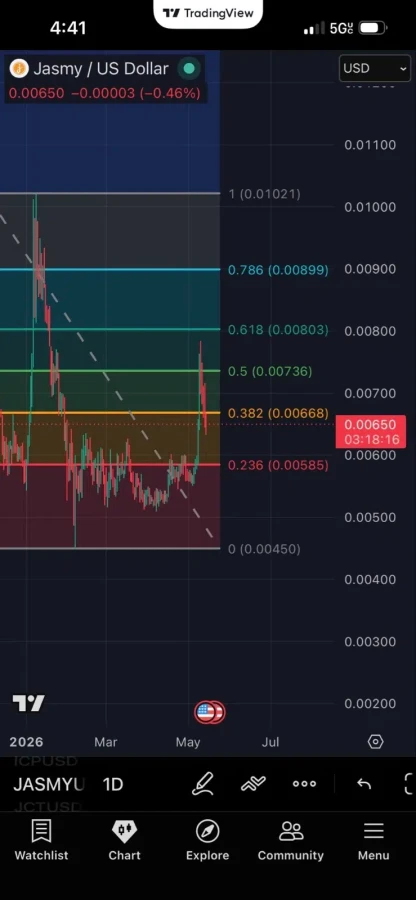
Source: The JASMY Empire’s X Post
The extended outlook is still bearish for the JASMY price, as the market has barely hit the 13-week mark of its present trend downward. Further declines may well be expected, especially if the price fails to convincingly break above the 0.5 Fibonacci retracement level.
Breaking above this level may reverse the momentum, which might indicate the beginning of a reversal pattern currently taking shape.
Technical Indicators Point to Increasing Selling Pressure
According to TradingView, the JASMY price remained calm for two months while ranging in a tight range from $0.0051 to $0.0060, after which it entered into May with an impressive break higher, hitting its peak at $0.0079.
However, the advance became overstretched above the Bollinger Bands, thus triggering a quick reversal back down, breaking below the 20-day SMA to test a new support around $0.00591.

Source: TradingView
The momentum oscillator is giving a strong indication of this current bearish trend. There is a significant increase in the Bollinger Bands at the rally, but there is a pullback to the bottom of the bands at $0.00501.
In addition, the MACD indicator has crossed below the signal line while the histogram is negative, which also points to a downward movement for the JASMY price.
This article contains market analysis and price predictions. These are not guarantees. Crypto markets are volatile. Always DYOR. Not financial advice.
Also Read: JASMY Price Prediction: Bullish Structure Points to a Rally Toward $0.0099

Be the first to comment