



What to know:
- The WLFI price trades near support as a falling wedge pattern signals a possible bullish reversal.
- A breakout above $0.0600 resistance may push WLFI toward the $0.0610 target zone.
- RSI and MACD indicate recovering momentum with reduced bearish pressure.

World Liberty Financial (WLFI) is showing early signs of a potential bullish reversal as the WLFI price action forms a falling wedge pattern with weakening selling pressure. Technical indicators, including RSI and MACD, suggest improving momentum, while a breakout above key resistance could open the path toward higher targets.
At the time of writing, WLFI is trading at $0.05816, with a 24-hour trading volume of $37.82 million and a market capitalization of $1.84 billion. Despite remaining stable over the last 24 hours, the WLFI price structure indicates signs of a potential bullish reversal ahead.
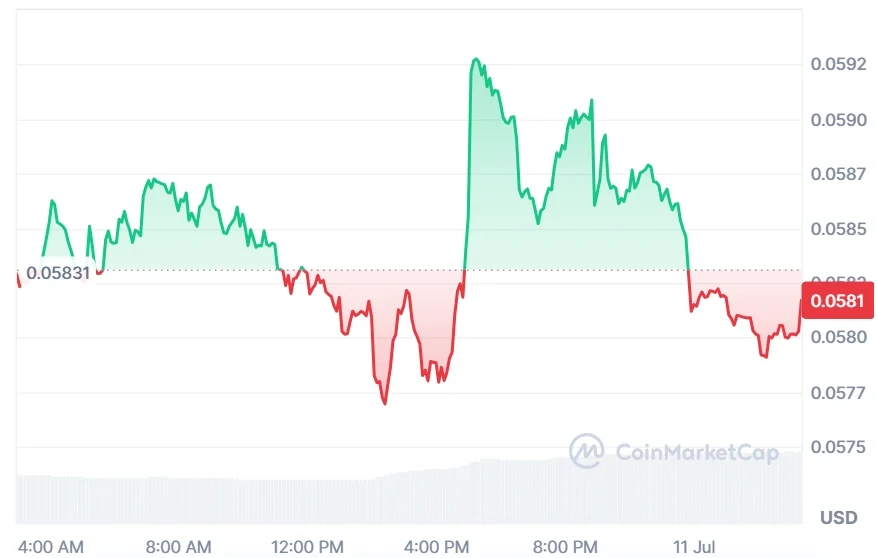

Source: CoinMarketCap

Also Read: WLFI Price Prediction 2026-2032: Will World Liberty Financial Reach $1?
WLFI Price Eyes Falling Wedge Breakout
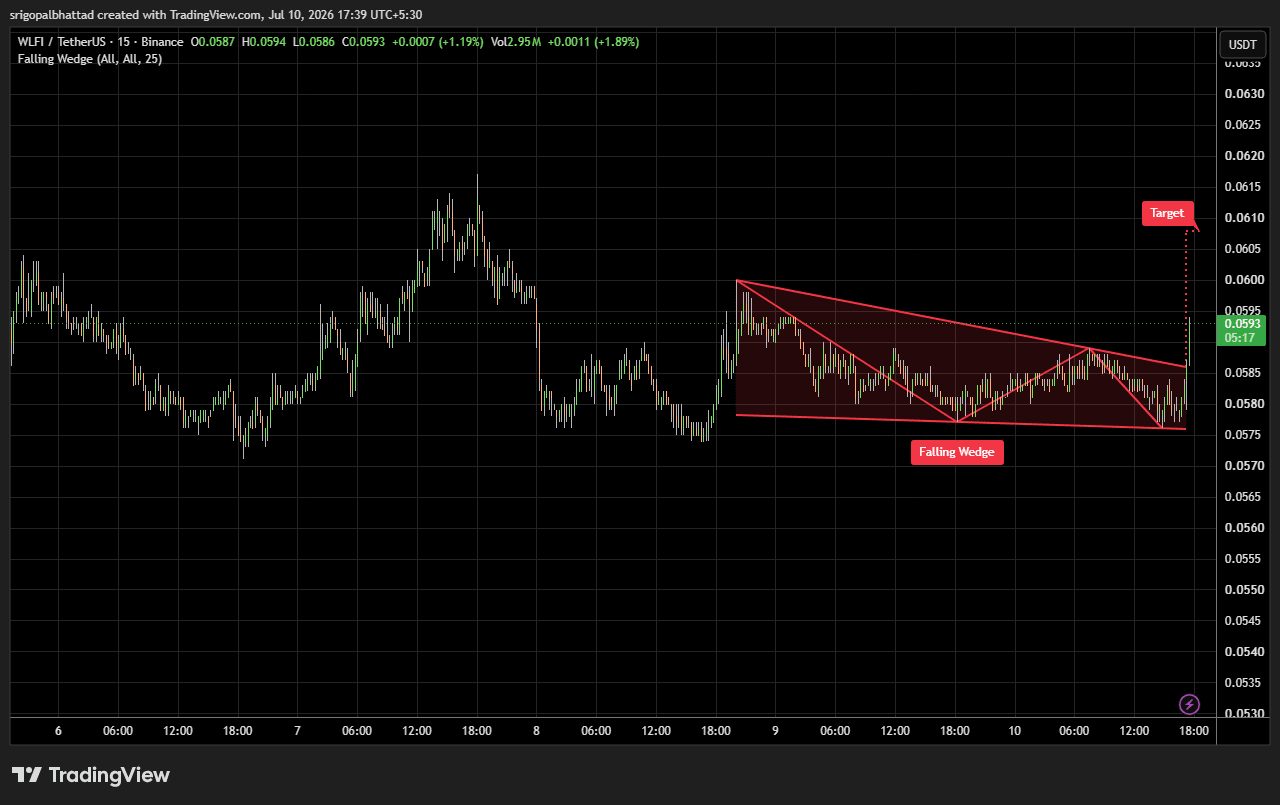
According to the crypto analyst Crypto With Gopal, the WLFI price is forming a falling wedge pattern on the 15-minute chart, indicating a possible bullish reversal setup.
The WLFI price is trading near $0.0593 after a period of consolidation, while lower highs and stable support around $0.0575 suggest weakening selling pressure.
The key breakout zone remains between $0.0595 and $0.0600, where the upper wedge resistance is positioned.
Source: Crypto With Gopal’s X Post
A breakout from this level combined with increased volumes will prove that there is an uptrend developing and take the WLFI price close to the objective at $0.0610.
The nearest support level lies at $0.0580, while an important support level is located at $0.0575. A breakdown below the $0.0575 level will nullify the formation.
RSI and MACD Show Recovery Signs
According to TradingView, the technical indicators reveal the market to be balanced since the WLFI price shows signs of recovery. RSI is balanced at 47.32, where its moving average stands at 47.24.
The indicator is on the balance line, meaning that neither buyer nor seller seems to have control over the token. A rise above 50.00 would give the trend strength.

Source: TradingView
MACD appears to be gaining more popularity, with its primary line at -0.00034 while the secondary line is at -0.00046.
Its histogram stands at 0.00012, suggesting weak bearish sentiment with the possibility of an early recovery. The latest crossover suggests increasing strength, although more will be required to prove that trend.
Despite the bullish price predictions and improving technicals, the WLFI price is still moving in the neutral phase. However, the general trend in the crypto market is turning positive due to BTC’s upward momentum, and the next few sessions of the WLFI price will determine its direction.
Also Read: WLFI Price Prediction 2025-2031: Will World Liberty Financial Price Hit $1?
This article contains market analysis and price predictions. These are not guarantees. Crypto markets are volatile. Always DYOR. Not financial advice.



Be the first to comment