


What to know:
- SEI forms bullish reversal within a descending wedge pattern, with key support at $0.042–$0.050.
- RSI rises to 63, showing stronger buying momentum as SEI reclaims 20-day and 50-day EMAs near $0.060.
- Breakout targets $0.358 short-term and $0.762 long-term if SEI clears 100-day and 200-day EMAs.

Sei (SEI) is moving in an upward price trajectory as BTC has started upward movement after the recent cooling-off period. Furthermore, the derivative data also supports SEI price breakout with rising open interest and volume. According to CoinMarketCap, POL is currently trading at $0.06482, with the gain of 6.39% over the last 24 hours.

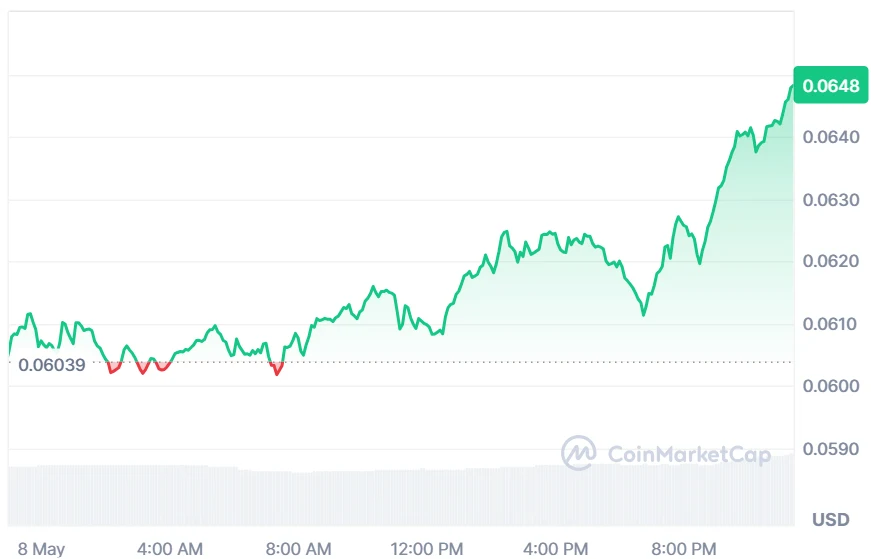
Source: CoinMarketCap
According to Coinglass, SEI open interest rose by 24.24%, climbing to $77.24 million, indicating increased positioning in the market. This suggests growing trader commitment and potential continuation of current trends with stronger engagement in derivatives activity.


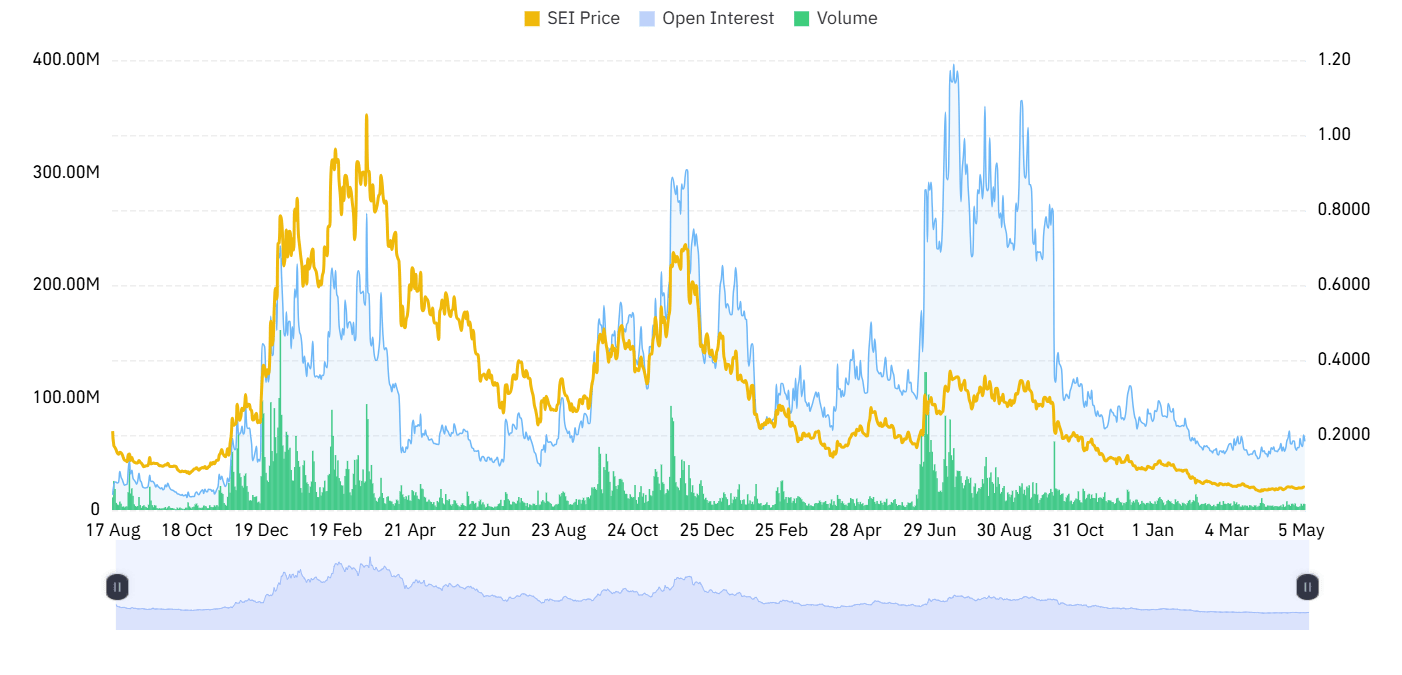
Source: Coinglass
However, the trading volume increased by 4.47%, reaching a total of $101.67 million. This reflects stronger market activity and participation, suggesting improved liquidity and heightened interest among traders in recent sessions.
Also Read: SEI Descending Channel Breakout Hints at Major Upside Move Toward $0.19
SEI Price Breakout Signals Major Bullish Reversal
Furthermore, the crypto analyst Atakan Altun Öz pointed out that SEI is on the verge of halting its prolonged downtrend, as the token moves towards a breakout area within a falling wedge pattern.
Experts believe that $0.0420-$0.0500 is the critical bullish defense line that should not be breached at any cost. Holding the token above this level may indicate renewed buying interest and pave the way for a strong rebound.


Source: Atakan Altun Öz’s X Post
According to technical expectations, a breakout may take the SEI price to the first objective level of $0.358. The bigger picture suggests that SEI may move up to the price level of $0.762.
Growing trading volume at the low price supports a positive outlook on further growth momentum development.
SEI Price Outlook Turns Bullish as RSI Climbs to 63
According to TradingView, the SEI price has gradually moved down from February through early April, dropping its price from $0.12000 to about $0.04900, and is still below the important EMAs.
The recent trend has been flat, and even the SEI price has reclaimed the levels of 20-day EMA and 50-day EMA, which are just around $0.06000.
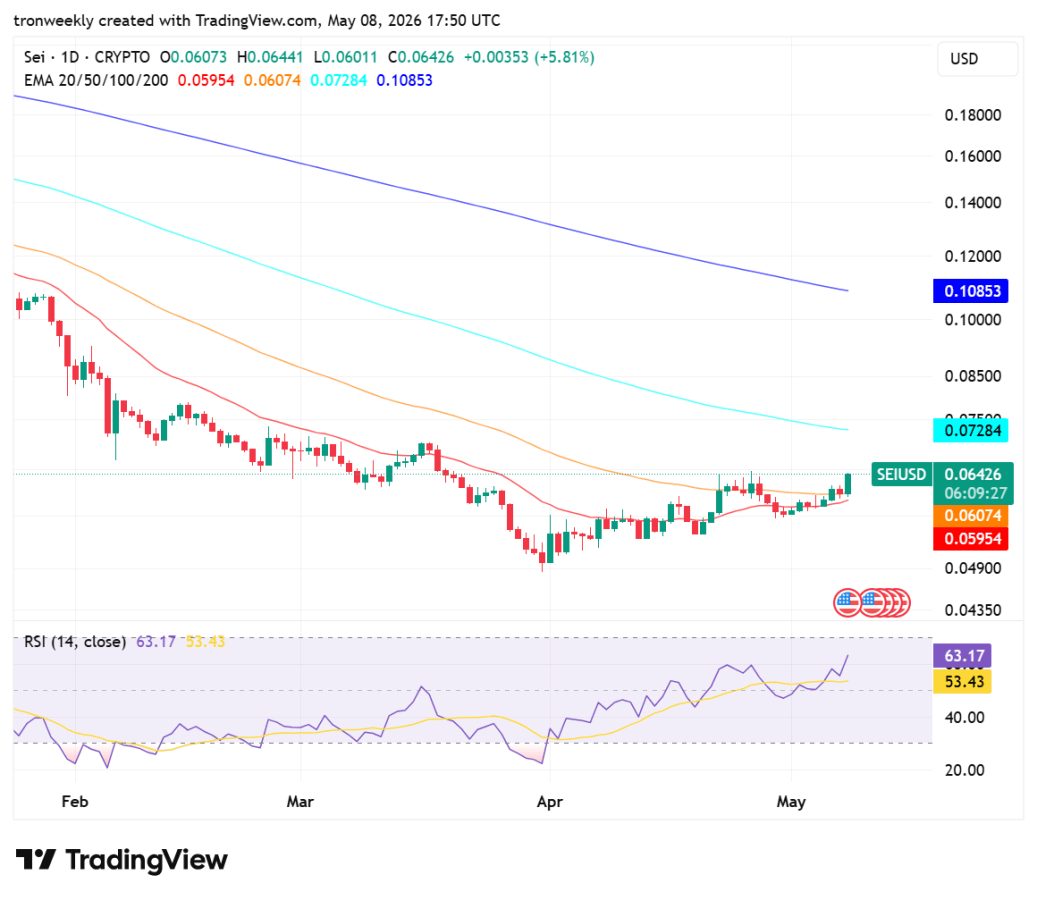
Source: TradingView
The momentum is gradually tilting towards bullish as the RSI moves up towards 63.17, indicating increasing buying strength.
However, the token has a massive ceiling ahead. In order for the trend reversal to be fully validated, the SEI price will need to break above the 100-day EMA of $0.07284 and the 200-day EMA of $0.10853.
This article contains market analysis and price predictions. These are not guarantees. Crypto markets are volatile. Always DYOR. Not financial advice.
Also Read: SEI Descending Wedge Signals Potential Reversal Toward $0.50 Target
Be the first to comment