


What to know:
- Bitcoin holds near key support as rising volume and weekly losses keep pressure active.
- Analysts say BTC needs a clear support reaction to avoid deeper downside pressure.
- Liquidity sits near $67,500-$68,500, while $60,000-$61,000 remains a key support zone.

BTC price analysis remained cautious on Wednesday, June 24, 2026, as Bitcoin traded near a key support area. Traders tracked weak weekly movement, rising activity, and liquidation zones that could shape the next directional move.
As of press time, Bitcoin (BTC) is trading at $62,819, marking an increase of 0.36% in the past day. The 24-hour trading volume is showing a strong surge up 15.16% and is currently standing at $29.35 billion. Over the last week, the coin price has decreased by 4.3%, according to CoinMarketCap.
Also Read: NEAR Price Outlook: Can $1.90 Support Spark a 20% Rally?

BTC Price Analysis Signals Bearish Wave Pressure
Crypto analyst TARA highlighted that Bitcoin may be tracking a downside wave structure. The analyst outlined a move toward $57,500 first. She marked $54,500 as the target if the decline continues.
The view is associated with a growing wave 3 setup. TARA subdivided the move into smaller sub-waves to track the price action. The analyst noted that Bitcoin could still be in subwave 2 of wave 3.
The BTC price analysis also indicates a potential retest around $64,400. That level may be tested, the analyst said. A rejection from that region could push Bitcoin towards $58,400 and provide a new low.
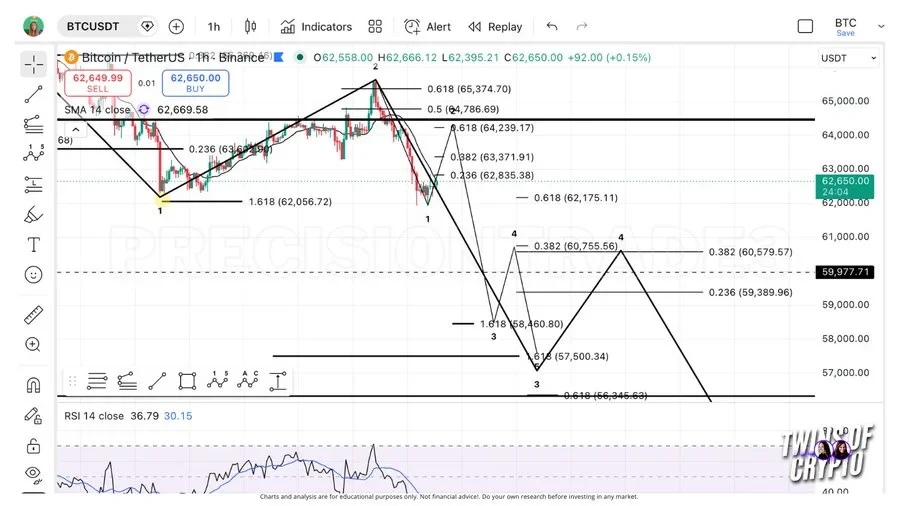

The analyst said such a drop would support the wider path toward $54,500. She added that Fibonacci levels are only projections. Those levels may change as actual price action develops.
Bitcoin Buyers Face Key Test Near $61,000
Moreover, another analyst, More Crypto Online, remained cautious with regard to the short-term roadmap of Bitcoin. The analyst mentioned current price action lacked enough strength to confirm a bull market return. The corrective structure remained in focus, with downside pressure.
The analysis put the support cluster at $60,000 to $61,000. The BTC price analysis indicates that buyers require a definite reaction from that range. If not, downside pressure can remain active.
A bigger Wave 2 bounce remains open provided support is not broken. The analyst said that buyers need to form a clear five-wave move higher. That could allow Bitcoin to attempt a corrective rally.


BTC has surpassed the initial resistance level of $62,457, with the next resistance level at $63,053. The buyers must have a definite break above the second level to continue the short-term momentum.
Nevertheless, analysts still consider the move as corrective unless Bitcoin establishes a stronger upside structure.
Bitcoin Faces Upside Liquidity Cluster Near $68,500
The Binance liquidation heatmap data shows high liquidity over price. Bitcoin fell from nearly $77,000 on May 24 to around $59,500 on June 6. Since then, it has traded mostly between $60,000 and $66,500.
The largest liquidation zone was seen around $67,500 – $68,500. More liquidity appeared near $70,000, $73,000, and $75,000. If buyers break nearby resistance, then these levels could turn out to become upside targets.
On the downside, the liquidity was slightly lighter but clearly visible around $61,000 and $60,000. If a dip below $62,000 occurs, it may test that support zone again. In the meantime, BTC price analysis suggests range trading conditions with an active bear risk.
This article contains market analysis and price predictions. These are not guarantees. Crypto markets are volatile. Always DYOR. Not financial advice.
Also Read: Bitcoin Selling Activity’s Drastic Drop to Massive 962 BTC

Be the first to comment