


Bitcoin has staged an aggressive breakout after weeks of compressed price action, pushing through several important resistance levels in a short period. While the move has materially improved the technical picture, BTC is now approaching another major supply area, making the sustainability of the breakout the key question.
Bitcoin Price Analysis: The Daily Chart
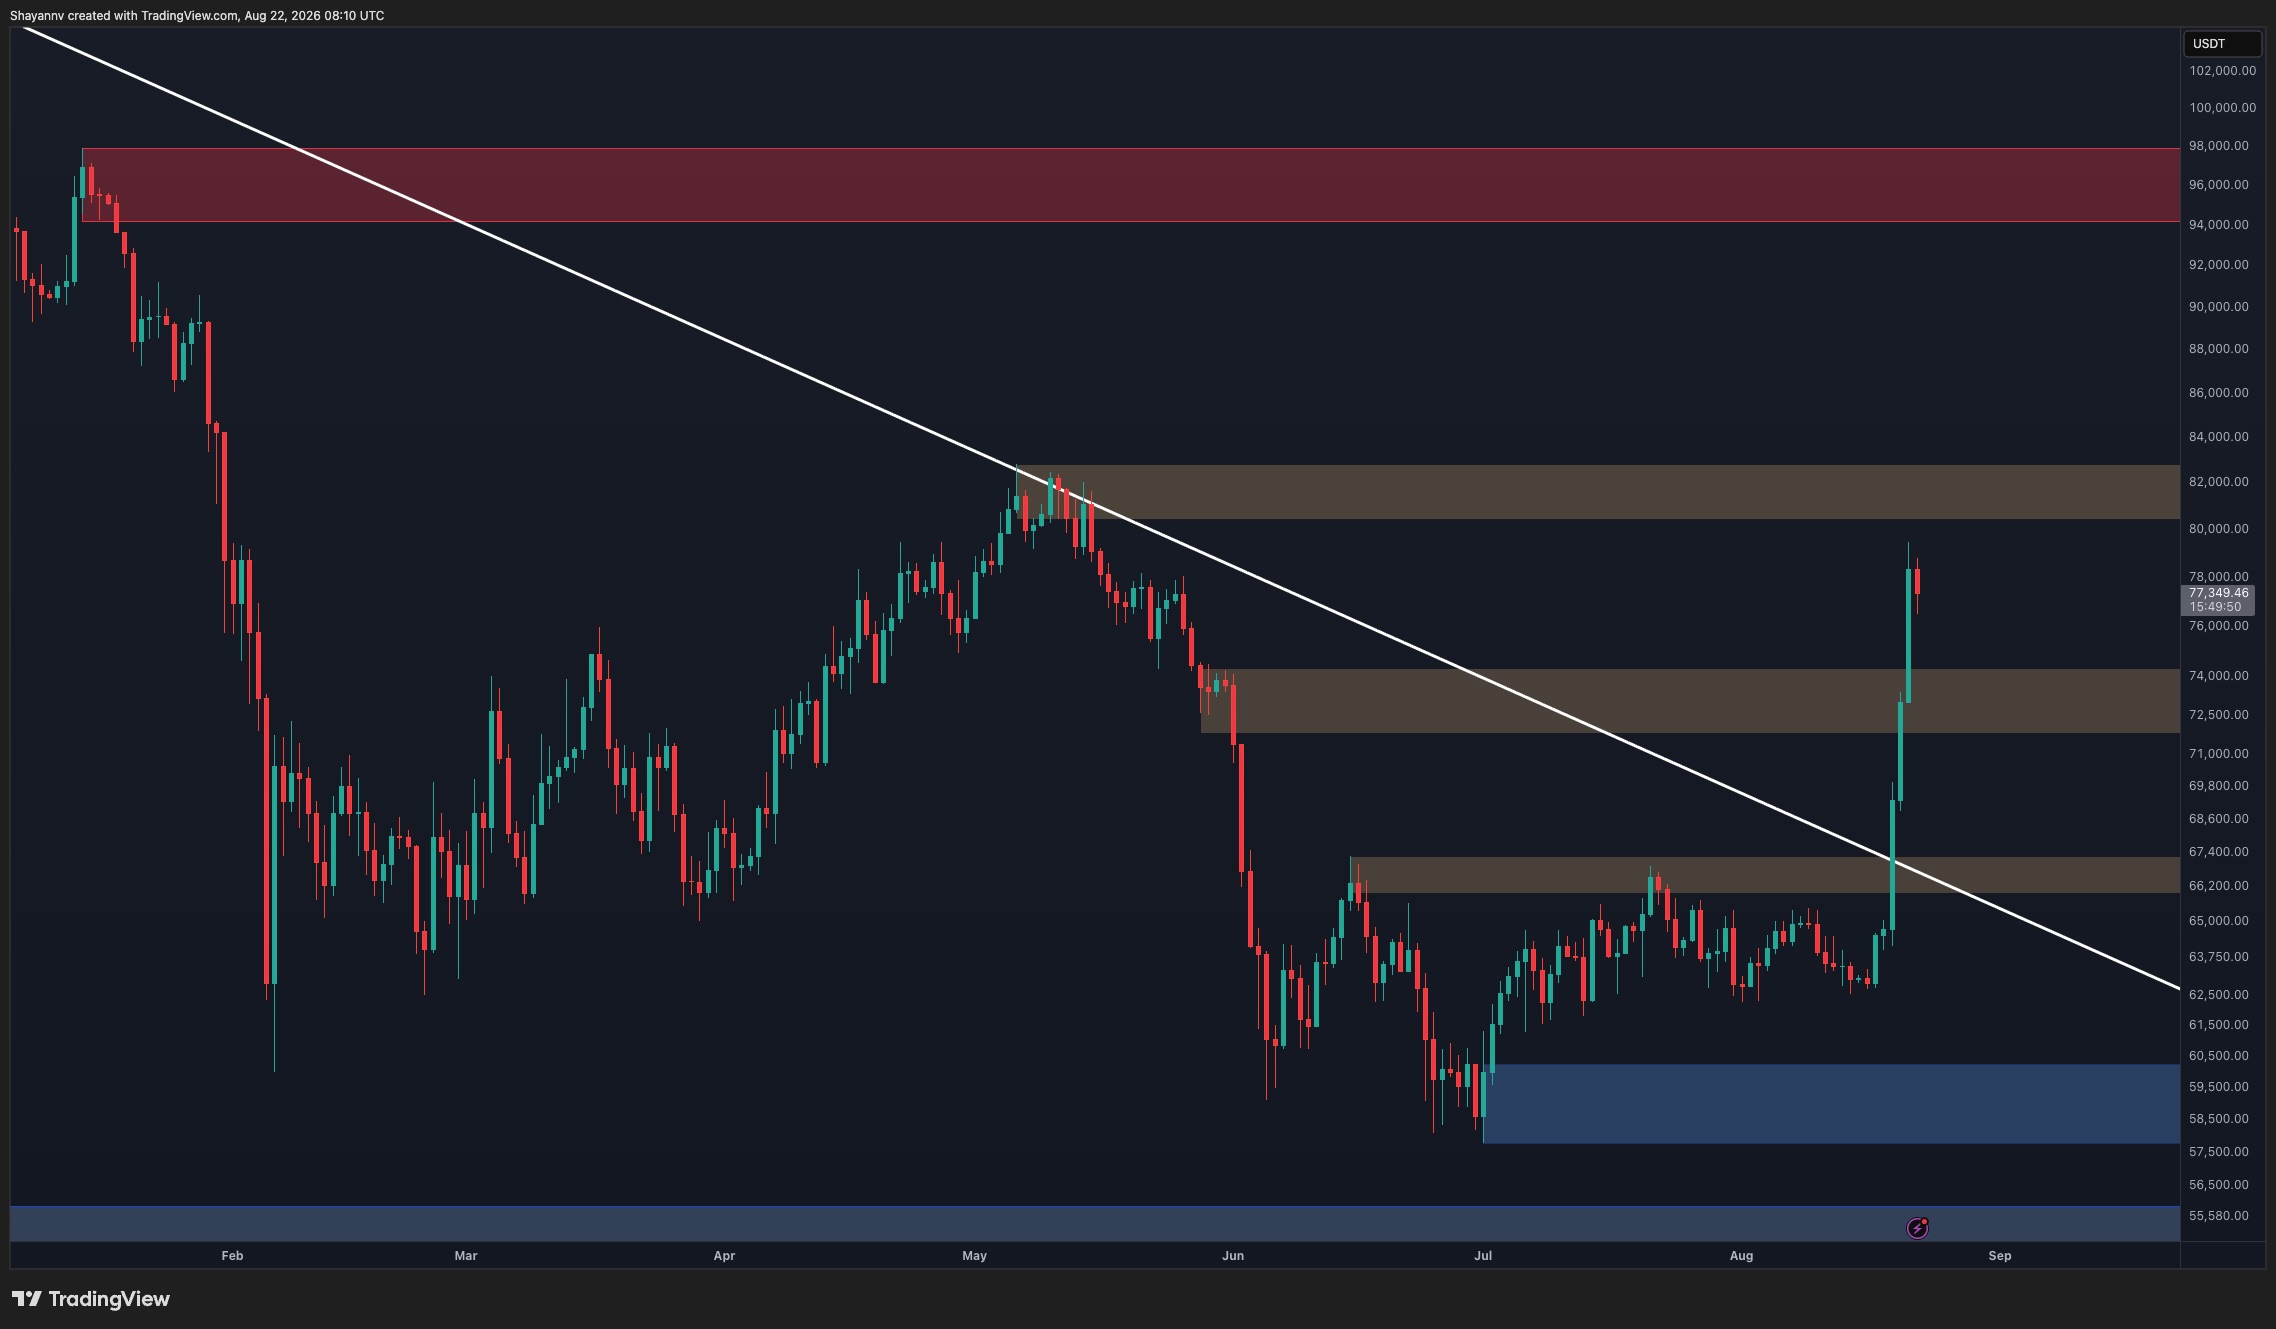
On the daily timeframe, Bitcoin has decisively broken above the long-standing descending trendline and the $66K-$67K resistance zone. The breakout was followed by an exceptionally strong expansion, with price also clearing the intermediate $72K-$74K supply area and reaching roughly $79K before pulling back toward $77K.
This represents a notable shift in market structure. The descending trendline had capped BTC throughout the broader correction, so reclaiming it alongside multiple horizontal resistance zones suggests buyers have regained control, at least in the near term.
However, price is now approaching the major $80K-$83K resistance zone. This area previously marked an important swing high and could attract profit-taking following such a rapid advance. A breakout and daily acceptance above $83K would further strengthen the bullish structure and potentially open the way toward the much larger $94K-$98K supply zone.
Conversely, after such a vertical move, a correction would not necessarily invalidate the breakout. The former $72K-$74K resistance zone is now the first major area to monitor as potential support. Holding this region on a pullback would reinforce the idea that the recent move represents a genuine structural reversal rather than a temporary liquidity-driven spike.
BTC/USDT 4-Hour Chart
The 4-hour chart highlights the strength of the breakout more clearly. Bitcoin escaped the converging trendline structure around $64K-$65K and accelerated almost vertically, eventually reaching approximately $79.5K.
Given the speed of the advance, the market is now extended from its breakout point, increasing the probability of short-term consolidation or a corrective retracement. The $72K-$74K zone is the first significant support area, while the Fibonacci levels shown on the chart provide deeper retracement references at roughly $71.1K, $69.1K, $67.7K, and $66.3K.
The $66K-$67K region is particularly important because it combines the former horizontal resistance area with the broader breakout structure. A deeper correction into this region, followed by strong demand, could still preserve the bullish setup.
For now, the immediate obstacle remains the $79.5K high followed by the $81K-$83K supply zone. A period of consolidation beneath this resistance would be relatively constructive, whereas an immediate rejection followed by a loss of $72K could indicate that the market needs a considerably deeper reset before attempting another leg higher.

On-chain Analysis
The Realized Price UTXO Age Bands chart provides additional context for the breakout by showing the average acquisition prices of different groups of Bitcoin holders.
The most relevant development is that BTC’s surge toward $79K has pushed spot price above the realized-price levels of the shorter-term 1-3 month and 3-6 month cohorts, which sit around $64K and $74K, respectively. This means these groups have broadly moved back into unrealized profit, reducing some of the pressure associated with underwater recent buyers.
At the same time, several older cohorts remain positioned considerably above the current market price. The 18-month to 2-year realized price is around $87K, while the 6-12 month and 12-18 month bands are much higher, near $95K and $105K. These levels could become increasingly relevant if the recovery continues, as BTC would begin approaching the cost bases of holders who remain underwater.
Therefore, the on-chain structure has improved alongside the technical breakout, but the recovery is not yet complete. Holding above the roughly $74K cost basis of the 3-6 month cohort would be particularly constructive, while losing it could indicate that the latest surge has moved ahead of underlying holder support.

Disclaimer: Information found on CryptoPotato is those of writers quoted. It does not represent the opinions of CryptoPotato on whether to buy, sell, or hold any investments. You are advised to conduct your own research before making any investment decisions. Use provided information at your own risk. See Disclaimer for more information.



Be the first to comment