


What to know:
- BONK price surges 10% after breaking key resistance, signaling strong bullish momentum in the short term.
- Technical indicators show overbought RSI at 82.25 and bullish MACD, confirming strong but potentially overheated momentum.
- Analysts eye $0.0000090 as the next upside target if BONK maintains support and resumes bullish continuation.

BONK price surged after breaking resistance but now faces short-term rejection and consolidation. Technical indicators show strong momentum with overbought RSI and bullish MACD. Derivatives data further highlights rising open interest and volume, signaling increased speculative activity and participation. According to CoinMarketCap, BONK is trading at $0.000007962 with a 24-hour gain of 10.23%.
BONK Derivative Data Point to Bullish Reversal
According to Coinglass, the BONK open interest rose by 13.76%, totaling $12.25 million, reflecting increased capital commitment in the market. This growth indicates stronger positioning by traders, rising speculative activity, and potential continuation of current trends depending on market sentiment and liquidity conditions.

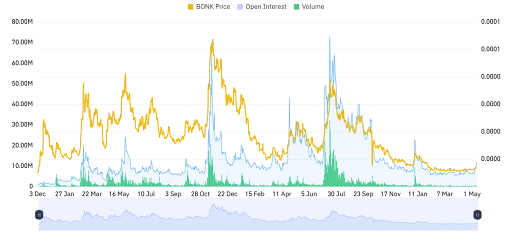
Source: Coinglass

Trading volume increased by 18.68%, reaching a total of $27.81 million, indicating stronger market activity and participation. This rise suggests heightened interest among traders, improved liquidity conditions, and potentially greater volatility in the asset.
Also Read: BONK Falling Wedge Breakout Could Trigger Rally Towards 0.0000260
BONK Price Targets $0.0000090 After Major Breakout
Furthermore, the crypto analyst Sjuul revealed that the BONK price showed a sudden uptrend due to a breakout from the previous level of resistance, creating an upward movement.
The breakout occurred because of buying momentum and speculation in the market for the short term. Now that the token has risen, the pace of trading has started slowing down, indicating resistance at the next level.

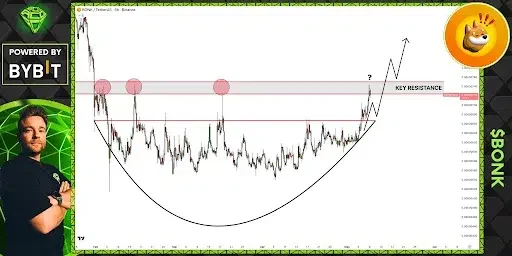
Source: Sjuul’s X Post
Despite rejection by the market at this critical level, the formation seems to be stable as opposed to bearish.
This is seen as a consolidation period after the fast pump, where traders are optimistic that a breakout could follow once momentum picks up again, pushing the BONK price up towards its next resistance level of $0.0000090.
Technical Indicators Reinforce Increasing Strength
According to TradingView, there is a remarkable breakout pattern shown by the BONK price after an extended period of ranging sideways to a breakout upwards.
The BONK price has been rising above its resistance level since late April with green candles that indicate strong buying interest. This parabolic rise shows the strength of positive sentiments among traders.


Source: TradingView
From a technical point of view, the BONK price is demonstrating a very high momentum. The Relative Strength Index (RSI) is at 82.25, indicating overbought conditions, which usually mean that a pause is going to happen soon.
As far as the Moving Average Convergence Divergence (MACD), the bullish divergence is widening, and the histogram bars keep growing.
This article contains market analysis and price predictions. These are not guarantees. Crypto markets are volatile. Always DYOR. Not financial advice.
Also Read: BONK Price Analysis: Bullish Breakout Targets Higher Resistance at $0.94
Be the first to comment