



What to know:
- VIRTUAL price gains momentum as a bullish falling wedge breakout approaches the resistance zone.
- MACD crossover signals strengthening buying pressure and fading bearish momentum ahead.
- RSI climbs above neutral, supporting continued upside without overbought market conditions.

The VIRTUAL price is showing signs of a potential bullish reversal as the price consolidates within a falling wedge while momentum indicators improve. Strong support continues to hold, and a confirmed breakout above resistance could trigger a sustained rally toward the projected technical target.
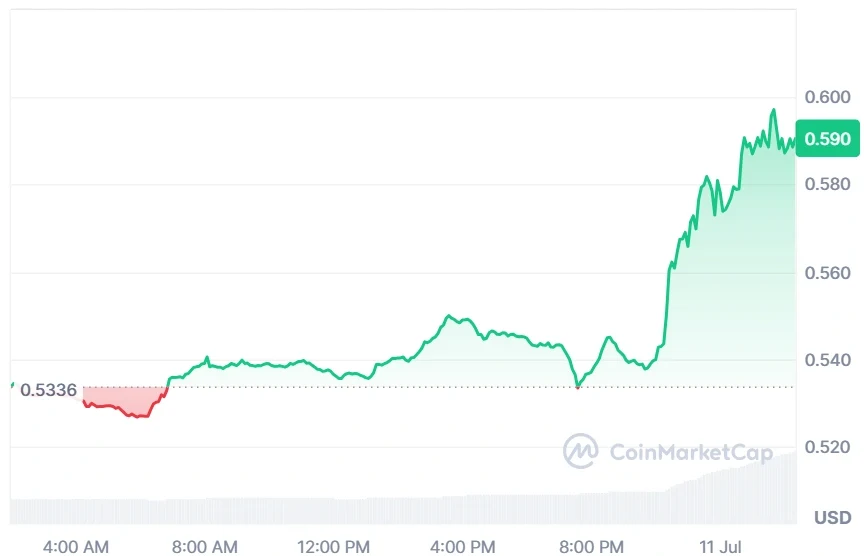
At the time of writing, VIRTUAL is trading at $0.5906, with a 24-hour trading volume of $60.2 million and a market capitalization of $386.23 million. Following the gain of 10.91% over the past 24 hours, the VIRTUAL price structure and growing network adoption suggest that a bullish reversal could be developing.

Source: CoinMarketCap

Also Read: VIRTUAL Price Prediction: Trendline Breakout Could Trigger Rally Toward $1
VIRTUAL Price Eyes Bullish Wedge Breakout
According to the crypto analyst Globe Of Crypto, the VIRTUAL price is trading within a well-defined falling wedge on the 12-hour chart after an extended downtrend. The descending resistance and rising support indicate weakening bearish momentum.
The VIRTUAL price is approaching the wedge apex, where a decisive breakout or rejection will likely determine the next directional movement ahead.
The immediate support remains around the $0.50–$0.52 zone, where buyers have repeatedly defended the VIRTUAL price.
A breakout above the wedge resistance could confirm a bullish reversal, opening the way toward higher resistance levels. Strong trading volume would add confidence and strengthen breakout confirmation significantly.

Source: Globe Of Crypto’s X Post
This indicates that a potential 71% rally towards the $0.95 zone is in the offing in case the VIRTUAL price breakout pattern sustains its course.
Falling below the support zone, however, would put this bullish structure in jeopardy. The next few 12-hour candles would possibly give clarity on who dominates the market going forward.
Momentum Indicators Support Bullish Outlook
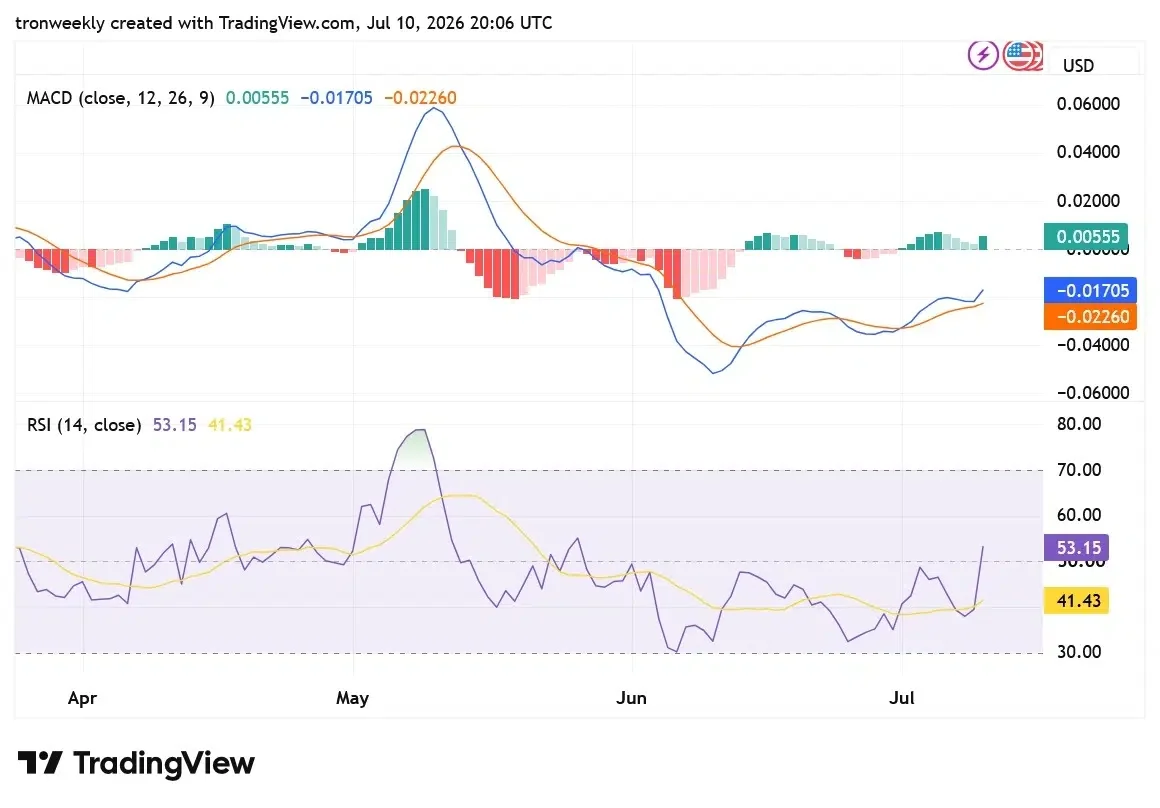
Momentum indicators are showing a preference for the buyers. There is a bullish trend developing with the MACD where the MACD line has crossed above the signal line by moving to -0.01705 from -0.02260. Moreover, the histogram is now positive at 0.00555, which suggests that bullish momentum is developing.
Source: TradingView
The relative strength index (RSI) has climbed to 53.15 and surpassed the signal average of 41.43 and the neutral point of 50. An increase in RSI indicates increasing strength in the market without being overbought, which means that the bulls have momentum.
Following the bullish price predictions and improving technicals, the VIRTUAL price is also surging in an upward direction. This move is also backed by the improving trend in the crypto market as Bitcoin has started to move upward again.
Also Read: VIRTUAL Price Prediction: Can Bulls Push It Toward $0.70 in Next Bull Run?
This article contains market analysis and price predictions. These are not guarantees. Crypto markets are volatile. Always DYOR. Not financial advice.


Be the first to comment