



Bitcoin is trading around $64,100 today, holding onto a roughly 2.6% weekly gain and pressing toward the top of a well-defined range. The bitcoin price today sits in a tug-of-war between a firm floor at $58,000 and a stubborn ceiling near $65,581 — and with June’s US inflation report due July 14, the next few sessions could set the tone for weeks. Here’s the full BTC price analysis.
What is the Bitcoin price today?
As of writing, BTC/USD trades near $64,100, up about 1.5% on the day and roughly 2.6% over the past seven days. The move comes after Bitcoin’s worst month in four years in June, making this rebound a meaningful recovery of composure rather than a fresh breakout. Notably, 24-hour volume has been running around 20% below its recent average — a sign the grind higher is happening on thin conviction, not a flood of buyers.
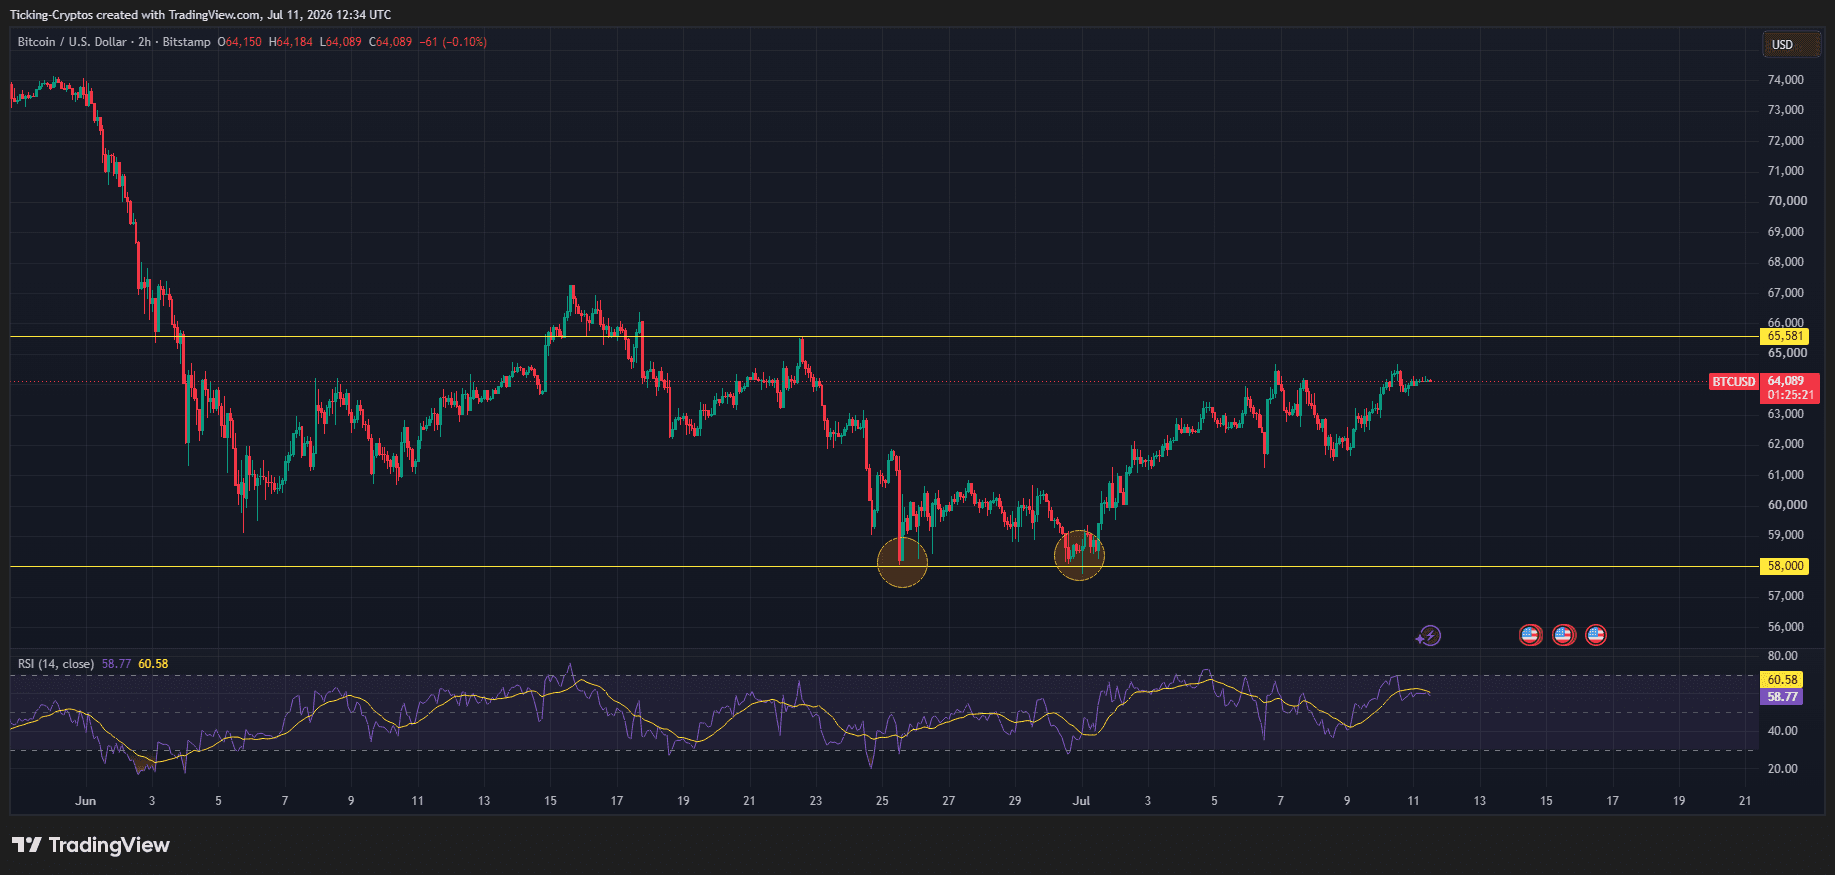
What are the key Bitcoin support and resistance levels?
The 2-hour chart lays out a clean range that’s easy to trade around:

- Resistance – $65,581: This is the line that matters. $BTC tapped it in mid-June and got rejected, and it’s capped every attempt since. A clean 2-hour close above it is the trigger bulls are waiting for.
- Support – $58,000: The lower boundary has been tested twice (late June and early July) and held both times, forming a higher-low structure. As long as this floor holds, the broader recovery stays intact.
- Current price – ~$64,100: BTC is trading in the upper third of the range, closer to resistance than support — a constructive sign, but not yet a breakout.
What is the Bitcoin RSI telling us?
Momentum is quietly bullish. The RSI (14) reads around 60, sitting above its signal line and comfortably in the upper half of the range without being overbought. That leaves room for further upside before buyers get exhausted — but it’s not the kind of stretched reading that screams “top.” In short: momentum supports another push at resistance, it just hasn’t confirmed the break yet.
Why does the July 14 CPI report matter for BTC?
This is the swing factor. June’s US Consumer Price Index lands on July 14, and it’s the next major macro catalyst for risk assets. Here’s why it’s pivotal:
- A cooler-than-expected print would revive hopes of Fed easing, likely pressuring Treasury yields and the dollar lower — a tailwind that could give BTC the fuel to clear $65,581.
- A hotter print would do the opposite, reinforcing higher-for-longer rate fears and potentially knocking Bitcoin back toward the middle of its range.
Complicating the picture, renewed Middle East tensions have nudged oil prices higher, which feeds back into inflation expectations — exactly the channel the market is watching. ETF inflows turned positive recently, but only for a single session, so it’s still unclear whether institutional buyers will step up after the data.
Bitcoin price prediction: what happens next?
The setup is a classic coiled range heading into a known catalyst. Two scenarios stand out:
- Bullish case: A 2-hour close above $65,581, ideally confirmed by a soft CPI print, opens the path back toward the June high near $67,250. Clearing that zone would flip the medium-term structure decisively bullish and put the $70,000 round number firmly in play — the next major psychological target and a level analysts widely flag as the gateway to a broader recovery.
- Bearish case: Rejection at resistance or a hot CPI print sends BTC back toward the $61,000–$60,000 mid-range, with $58,000 as the line that absolutely must hold. A break below it would expose deeper support and put the recovery in question.
The most likely near-term path is continued consolidation between $58,000 and $65,581 until CPI forces a decision. Traders will want to watch whether volume expands on any breakout attempt — a move through resistance on weak volume is far less trustworthy than one backed by real participation.
Can Bitcoin reach 70K soon?
Bitcoin is holding a constructive structure — higher lows, supportive RSI, and price pressing resistance — but it hasn’t yet earned a breakout. The $65,581 ceiling and the $58,000 floor define the battlefield, and the July 14 CPI report is the catalyst most likely to break the deadlock. Clear resistance on real volume and the road to $70,000 opens up; fail, and this stays a range to respect rather than a trend to chase.




Be the first to comment