



What to know:
- FLOKI tests $0.00001980 support as analysts watch for its next major directional move.
- A breakout above $0.0000210 could confirm the double-bottom setup and bullish momentum.
- A break below $0.00001980 could expose FLOKI to a deeper 20% decline toward $0.00001591.

The FLOKI price enters a key decision area as analysts watch for a double-bottom setup and descending channel support. The token is currently trapped between a bullish breakout and the potential risk of further falling below its support level on Sunday, August 2, 2026.
As of writing, FLOKI is trading at $0.00002048, showing a decline of 0.19% in the past day. The 24-hour trading volume is standing at $14.63 million, with a market capitalization of $196.11 million. Over the last seven days, the FLOKI price has gone down by 8.49%, according to CoinMarketCap.
Also Read: Chainlink (LINK) Price Could Rally to $12 if Bulls Defend Critical Support

FLOKI Price Tests Critical Channel Support
Popular analyst Crypto Patel revealed that FLOKI is testing one of its most critical levels since May. The token has been trading inside a downward channel pattern for three months now. The token is now testing the lower boundary near $0.00001980.
According to Patel, $0.00001980 can be the key for future movement. A successful defense will keep the bulls alive. Traders have to regain their momentum ahead of the expected recovery.
If the support holds successfully, FLOKI’s price can rally by 30% and 50%. The price targets of Patel include $0.00002285, $0.00002663, and $0.00002981, respectively. Each target depends on the channel floor remaining intact.
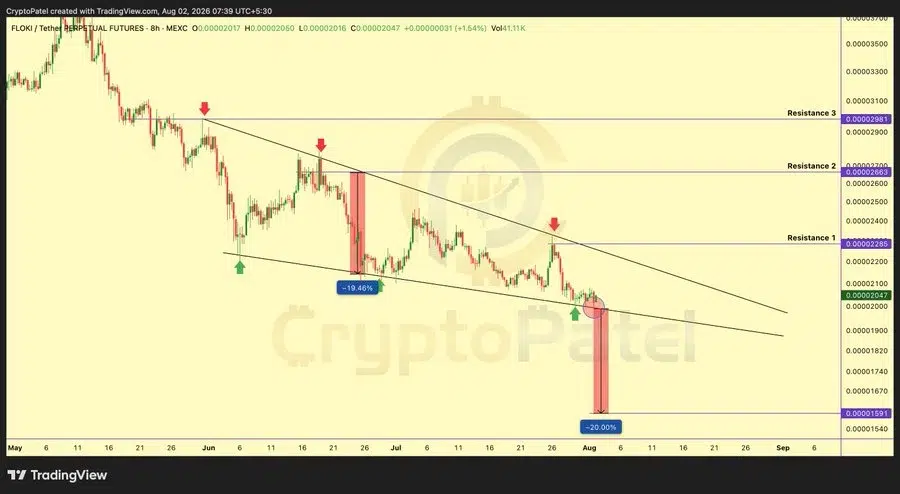
A confirmed break below the $0.00001980 level will make the bullish formation invalid. Patel predicted that the result may lead to another 20% drop and places the next support at $0.00001591.
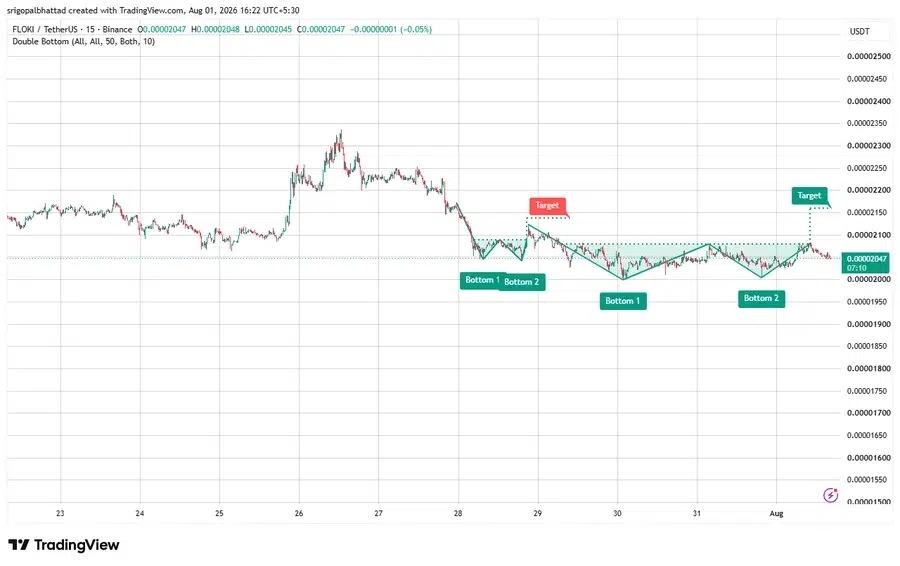
Moreover, another analyst, Crypto With Gopal, mentioned a double-bottom pattern. Buyers have repeatedly defended the $0.0000200 area. The repeated tests form the base of the potential reversal structure.
The neckline lies between $0.0000208 and $0.0000210. The FLOKI price must decisively break and hold above that range to confirm bullish momentum. Until then, the formation remains unconfirmed.
The analyst set the upside target between $0.0000216 and $0.0000218. This target range is dependent upon the confirmed breakout price above the neckline.
What Technical Indicators Signal for FLOKI
According to TradingView, the Relative Strength Index (RSI) value is 40.60. Its moving average is 40.68, leaving a gap of 0.08 points. FLOKI price momentum is below the neutral level of 50 but above the oversold level of 30.
The Moving Average Convergence Divergence (MACD) line value is -0.00000066. It is below the signal line of -0.00000065. The histogram reads at -0.00000001, showing that the negative gap is extremely narrow.
How Key Levels Define the Next FLOKI Move
Both analysts identify key confirmation levels. The double-bottom formation could be confirmed above the $0.0000210 level. On the other hand, the bearish channel could be confirmed below the level of $0.00001980.
The FLOKI price remains between the $0.0000210 breakout level and the key support level of $0.00001980. Both levels have not yet been validated. A decisive break beyond either boundary would provide clearer direction for the token’s next move.
Also Read: XRP Price Targets $1.30 Rally as ETF Investments Boost Market Confidence
This article contains market analysis and price predictions. These are not guarantees. Crypto markets are volatile. Always DYOR. Not financial advice.



Be the first to comment