



What to know:
- The ENA price eyes a breakout above $0.10, with a potential move toward the $0.13 target.
- Key support holds near $0.070, while a breakout above $0.098 could boost momentum further.
- Trading above short-term EMAs keeps ENA positioned for a test of upper resistance levels.
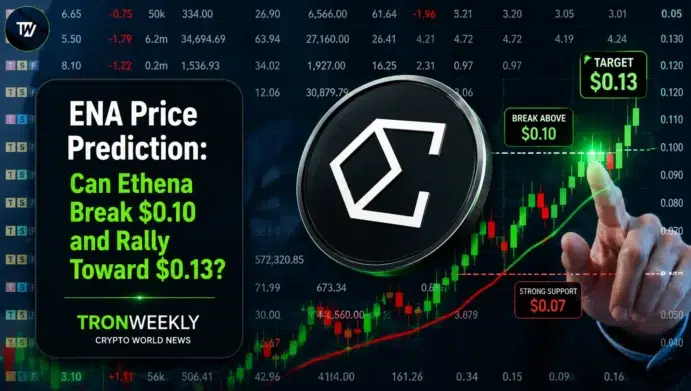
The ENA price is showing signs of a potential breakout on Tuesday, August 11, 2026, as analysts watch key resistance and support levels. The token is consolidating within a defined range, while technical indicators suggest that buyers are attempting to maintain upward momentum.
As of writing, Ethena (ENA) is trading at $0.08947, showing an increase of 0.17% in a day. The trading volume is currently standing at $102.72 million, with a market capitalization of $879.38 million. Over the last week, the coin price has decreased by 1.38%, according to CoinMarketCap.
Also Read: NEAR Price Eyes $1.92 as Bullish Momentum Builds Near Key Resistance

How Could ENA Price Breakout Open a Path to $0.13?
Analyst Crypto With Gopal noted that the ENA price is consolidating in a rectangular formation on the four-hour chart. The price is holding between around $0.070 and $0.098, and the token is trading near $0.090 within this range.
If a breakout of the $0.098-$0.100 region occurs, it will indicate the formation of a bullish trend. In addition, the analyst’s chart is predicting a possible target of $0.13. This move would signal a break from the current consolidation pattern.
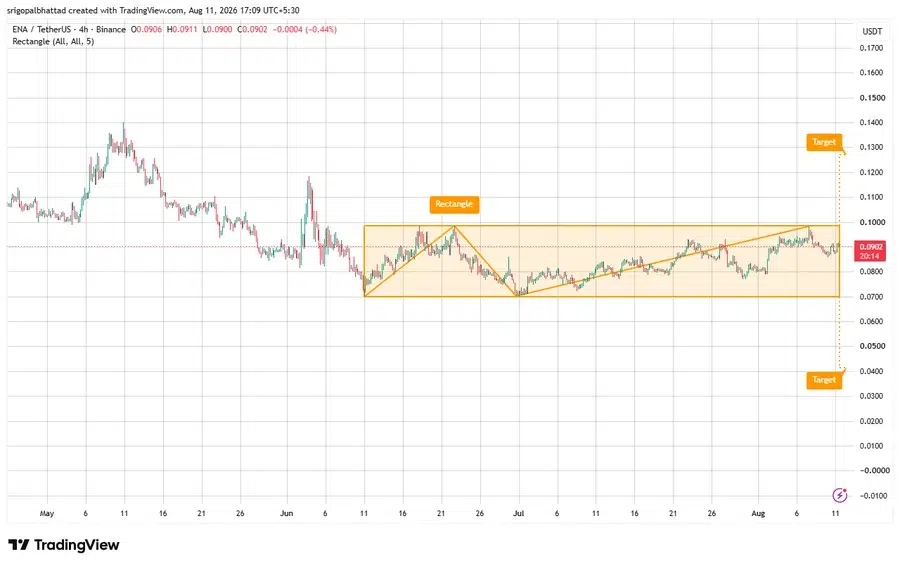
A breakdown of $0.070 will indicate invalidation of the bullish formation. If such a breakout occurs, the price may face a lower target of $0.04. The analyst marked the price of $0.070 as the most important level for this setup.
In addition, another analyst, Lana Valentis, mentioned that the ENA price is ready to explode. She noted that Ethena is forming a consolidation pattern above the small descending channel on the weekly chart. The formation of this pattern is similar to the previous one, which led to an explosion.
Valentis described levels below $0.10 as accumulation territory and said confirmation is still needed. Her listed targets are $0.13, $0.25, $0.47, $0.87, and $1.35. These levels were presented as targets rather than confirmed price outcomes.
Why Is ENA Open Interest Rising?
According to CoinGlass data, the future volume fell by 7.99% to $198.44 million, whereas the open interest rose by 2.81% to $230.85 million. The OI-weighted funding rate is recorded at 0.0046%, indicating continued activity in the market.
What Do ENA Technical Indicators Reveal?
According to TradingView, the 20-day EMA is positioned at $0.0874, while the 50-day EMA stands at $0.0864. Both averages are below the current ENA price of around $0.0894. This places the price above its short- and medium-term EMA levels shown on the daily chart.
The 100-day EMA is at $0.0931, keeping it above the current market price. The 200-day EMA is significantly higher at $0.1304. These longer-term EMA levels remain above ENA and provide the next reference points on the chart.
The Bollinger Band (BB) shows an upper band at $0.0965, a middle band at $0.0871, and a lower band at $0.0777. The current price is above the middle band but remains below the upper band. This places ENA within the range defined by the Bollinger Bands.
Also Read: David Schwartz Challenges Bitcoin Knots as BIP-110 Branch Stalls
This article contains market analysis and price predictions. These are not guarantees. Crypto markets are volatile. Always DYOR. Not financial advice.


Be the first to comment